

Answered step by step
Verified Expert Solution
Question
1 Approved Answer
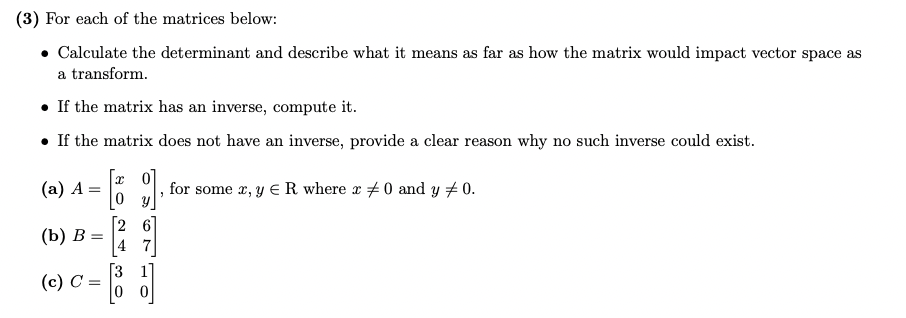
(3) For each of the matrices below: . Calculate the determinant and describe what it means as far as how the matrix would impact vector
Step by Step Solution
There are 3 Steps involved in it
Step: 1

Get Instant Access to Expert-Tailored Solutions
See step-by-step solutions with expert insights and AI powered tools for academic success
Step: 2

Step: 3
Ace Your Homework with AI
Get the answers you need in no time with our AI-driven, step-by-step assistance
Get Started
An Introduction to Analysis
Authors: William R. Wade
4th edition
132296381, 978-0132296380