

Answered step by step
Verified Expert Solution
Question
1 Approved Answer
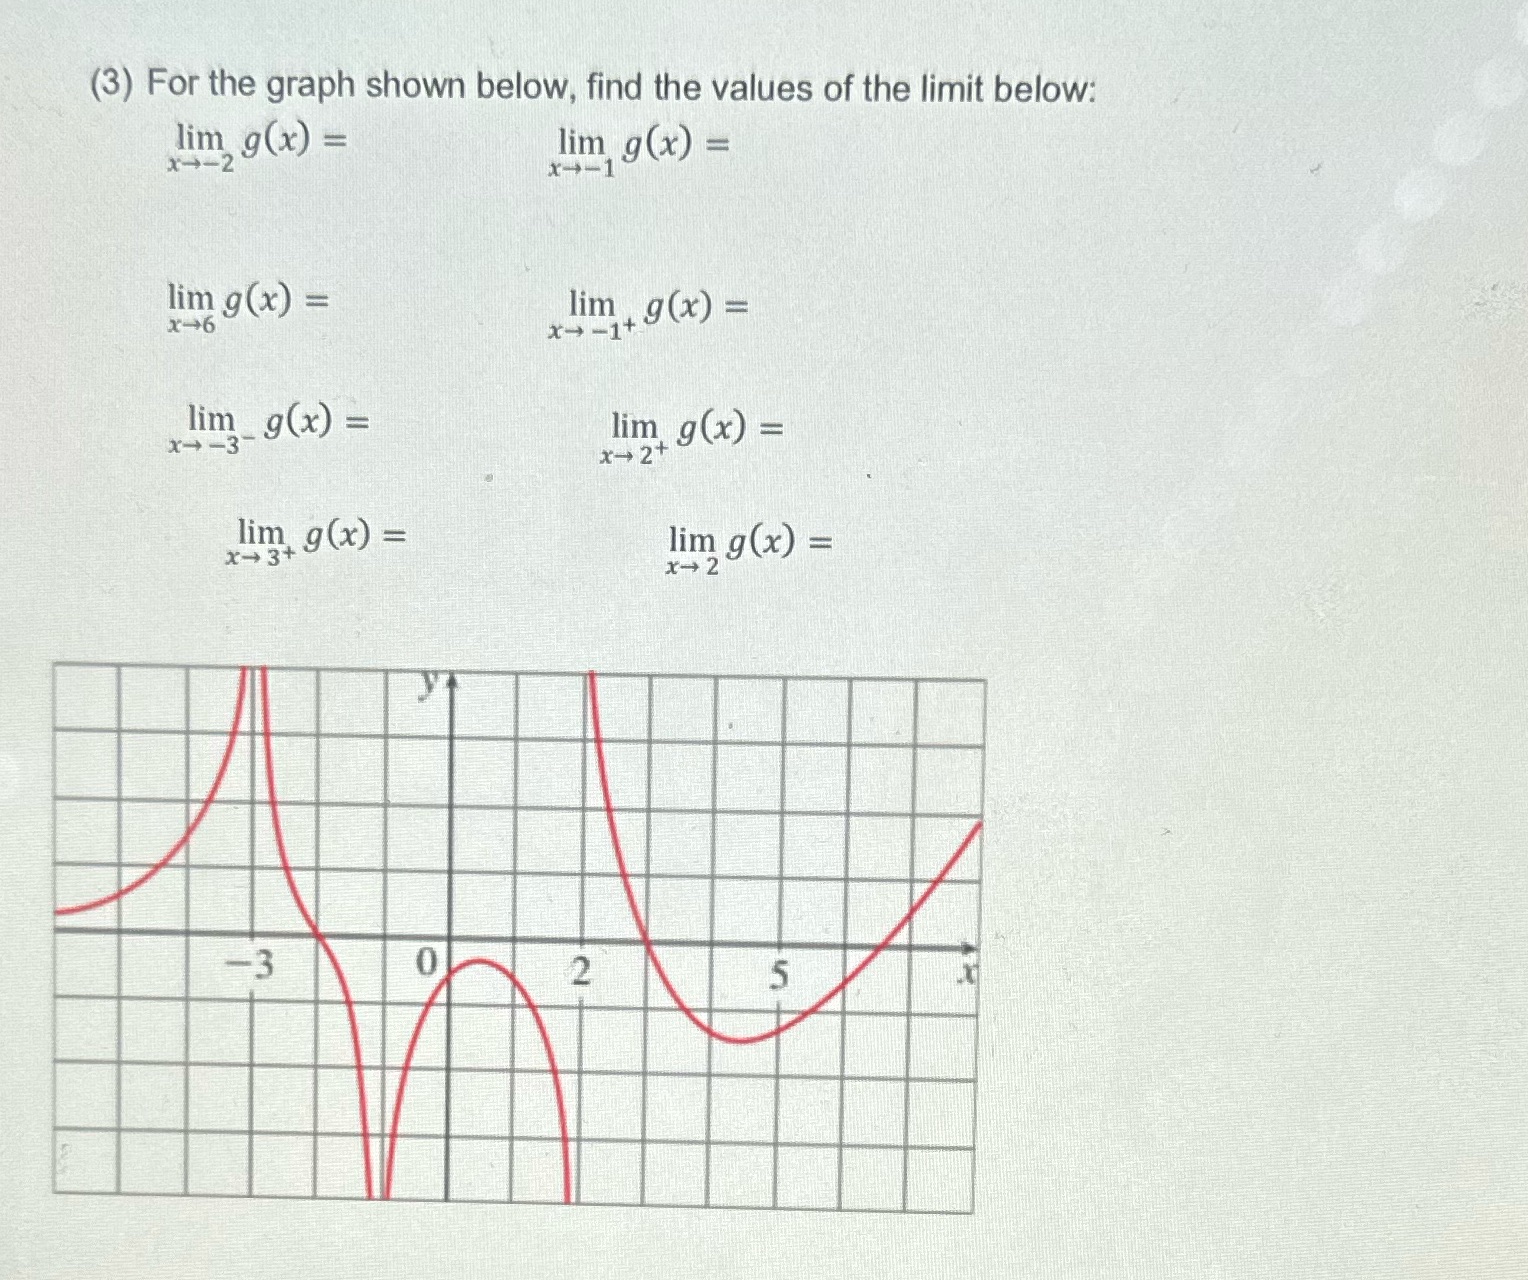
(3) For the graph shown below, find the values of the limit below: lim g(x) = X- - 2 lim g(x) = x--1 lim g(x)

Step by Step Solution
There are 3 Steps involved in it
Step: 1

Get Instant Access to Expert-Tailored Solutions
See step-by-step solutions with expert insights and AI powered tools for academic success
Step: 2

Step: 3
Ace Your Homework with AI
Get the answers you need in no time with our AI-driven, step-by-step assistance
Get Started
Precalculus Functions And Graphs
Authors: Dennis G Zill, Earl Swokowski, Jeffery Cole
12th Edition
1133172512, 9781133172512