

Answered step by step
Verified Expert Solution
Question
1 Approved Answer
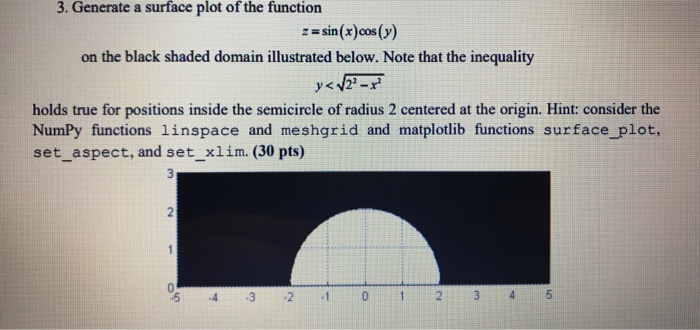
3. Generate a surface plot of the function z = sin (x)cos (y) on the black shaded domain illustrated below. Note that the inequality holds
Step by Step Solution
There are 3 Steps involved in it
Step: 1

Get Instant Access to Expert-Tailored Solutions
See step-by-step solutions with expert insights and AI powered tools for academic success
Step: 2

Step: 3
Ace Your Homework with AI
Get the answers you need in no time with our AI-driven, step-by-step assistance
Get Started
Spatial Databases A Tour
Authors: Shashi Shekhar, Sanjay Chawla
1st Edition
0130174807, 978-0130174802