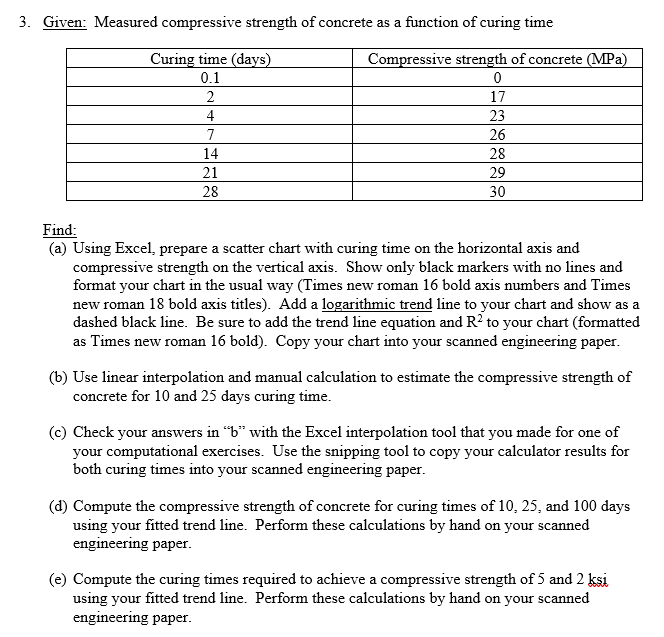
3. Given: Measured compressive strength of concrete as a function of curing time Curing time Compressive strength of concrete (MPa 0.1 17 23 26 28 29 30 14 21 28 in (a) Using Excel, prepare a scatter chart with curing time on the horizontal ais and compressive strength on the vertical axis. Show only black markers with no lines and format your chart in the usual way (Times new roman 16 bold axis numbers and Times new roman 18 bold axis titles). Add a logarithmic trend line to your chart and show as a dashed black line. Be sure to add the trend line equation and R2 to your chart (formatted as Times new roman 16 bold). Copy your chart into your scanned engineering paper (b) Use linear interpolation and manual calculation to estimate the compressive strength of concrete for 10 and 25 days curing time (c) Check your answers in "b" with the Excel interpolation tool that you made for one of your computational exercises. Use the snipping tool to copy your calculator results for both curing times into your scanned engineering paper (d) Compute the compressive strength of concrete for curing times of 10, 25, and 100 day:s using your fitted trend line. Perform these calculations by hand on your scanned engineering paper (e) Compute the curing times required to achieve a compressive strength of 5 and 2 ksi using your fitted trend line. Perform these calculations by hand on your scanned engineering paper 3. Given: Measured compressive strength of concrete as a function of curing time Curing time Compressive strength of concrete (MPa 0.1 17 23 26 28 29 30 14 21 28 in (a) Using Excel, prepare a scatter chart with curing time on the horizontal ais and compressive strength on the vertical axis. Show only black markers with no lines and format your chart in the usual way (Times new roman 16 bold axis numbers and Times new roman 18 bold axis titles). Add a logarithmic trend line to your chart and show as a dashed black line. Be sure to add the trend line equation and R2 to your chart (formatted as Times new roman 16 bold). Copy your chart into your scanned engineering paper (b) Use linear interpolation and manual calculation to estimate the compressive strength of concrete for 10 and 25 days curing time (c) Check your answers in "b" with the Excel interpolation tool that you made for one of your computational exercises. Use the snipping tool to copy your calculator results for both curing times into your scanned engineering paper (d) Compute the compressive strength of concrete for curing times of 10, 25, and 100 day:s using your fitted trend line. Perform these calculations by hand on your scanned engineering paper (e) Compute the curing times required to achieve a compressive strength of 5 and 2 ksi using your fitted trend line. Perform these calculations by hand on your scanned engineering paper