

Answered step by step
Verified Expert Solution
Question
1 Approved Answer
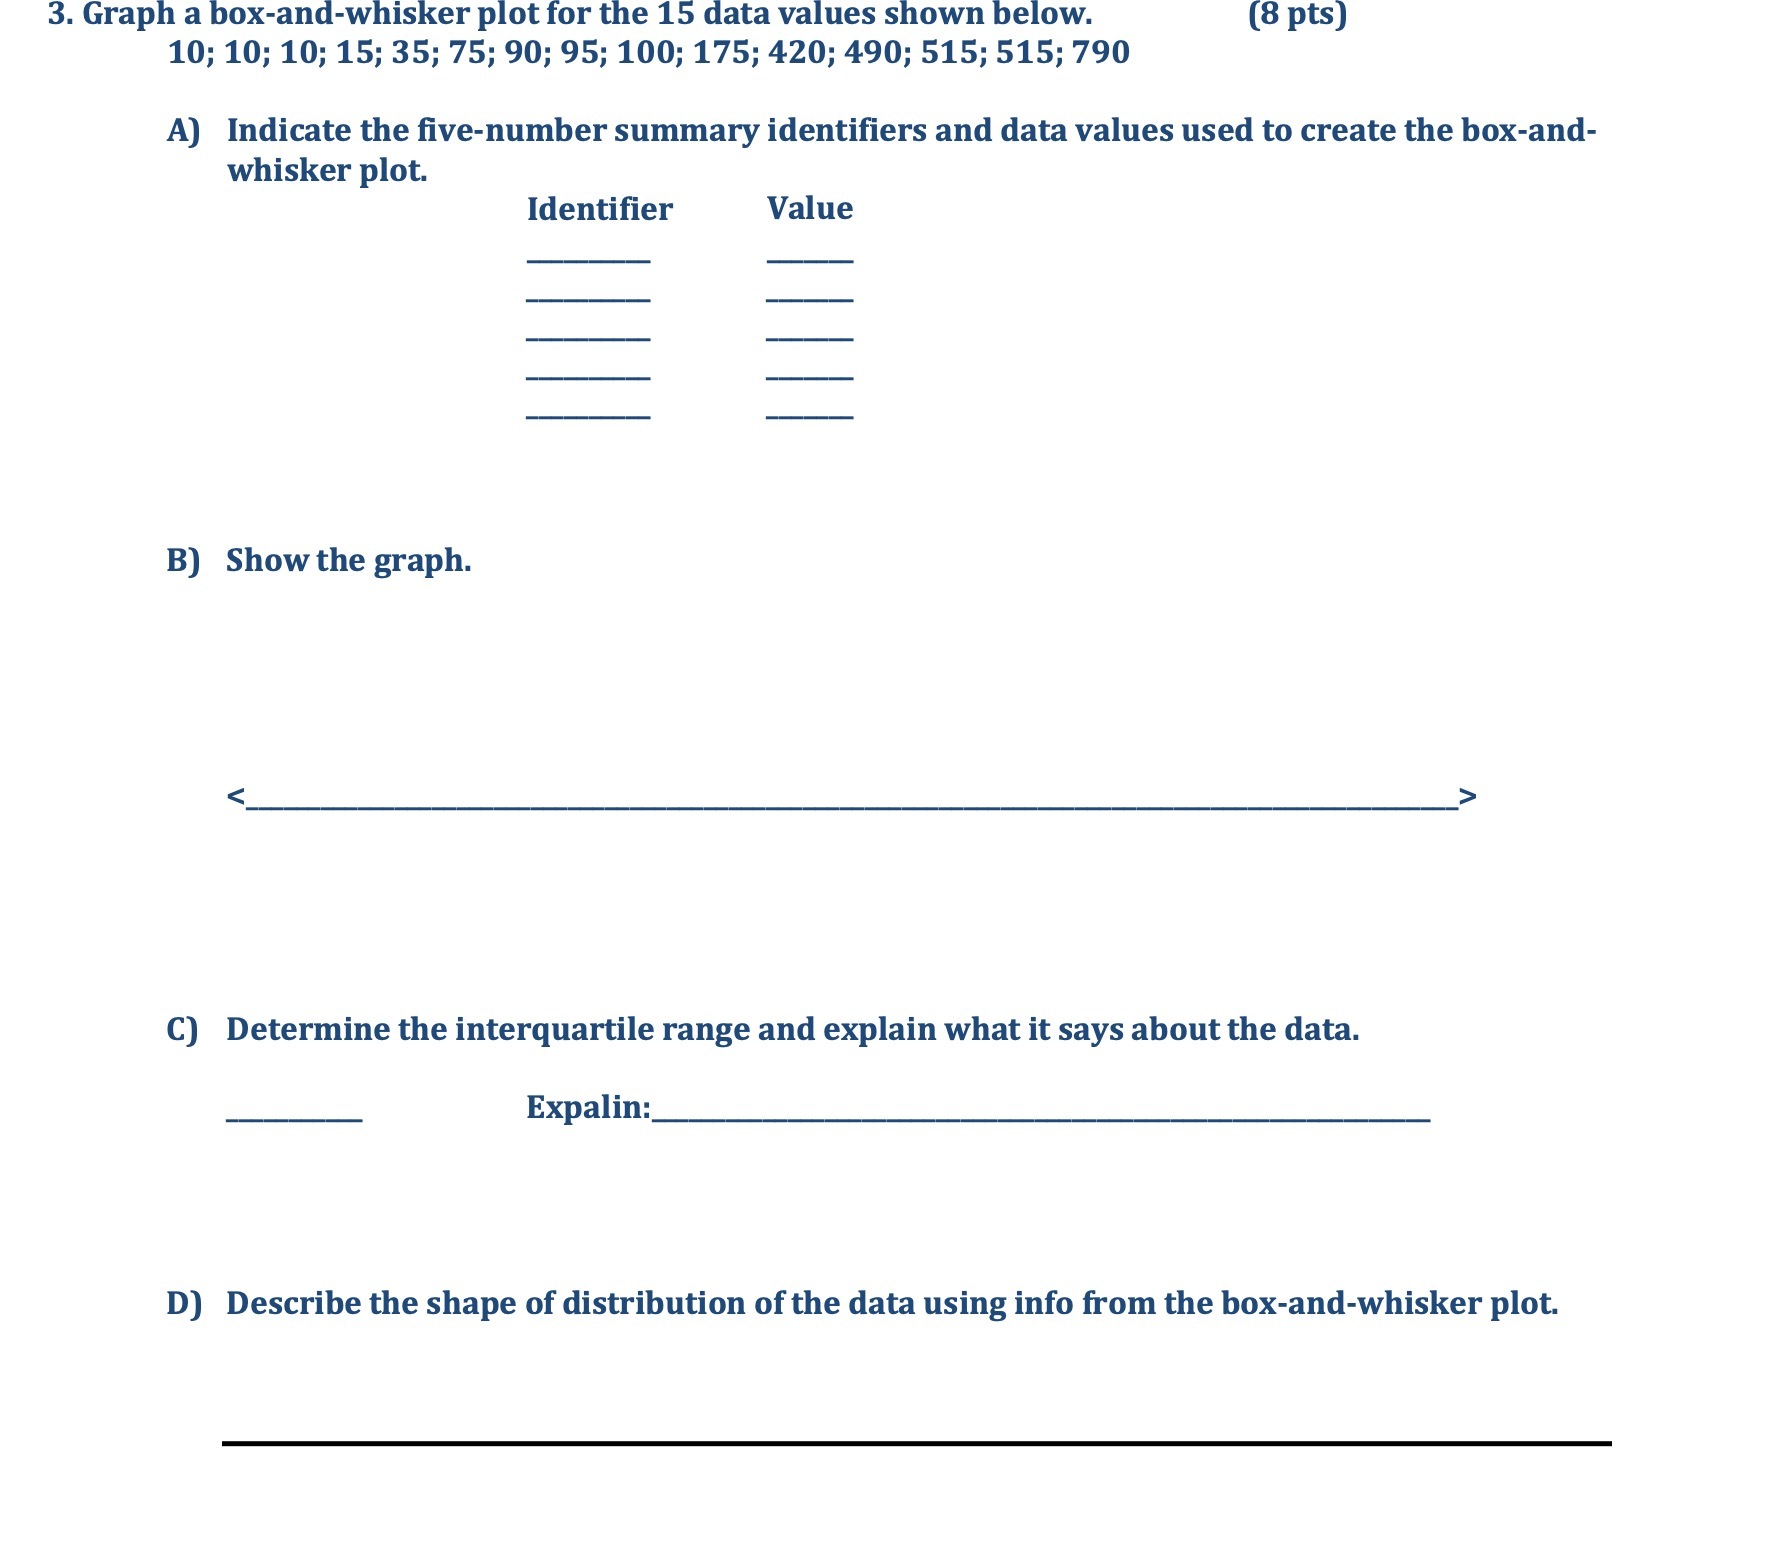
3. Graph a box-and-whisker plot for the 15 data values shown below. (8 pts) 10; 10; 10; 15; 35; 75; 90; 95; 100; 175; 420;
Step by Step Solution
There are 3 Steps involved in it
Step: 1

Get Instant Access to Expert-Tailored Solutions
See step-by-step solutions with expert insights and AI powered tools for academic success
Step: 2

Step: 3
Ace Your Homework with AI
Get the answers you need in no time with our AI-driven, step-by-step assistance
Get Started
A Survey of Mathematics with Applications
Authors: Allen R. Angel, Christine D. Abbott, Dennis Runde
10th edition
134112105, 134112342, 9780134112343, 9780134112268, 134112261, 978-0134112107