

Answered step by step
Verified Expert Solution
Question
1 Approved Answer
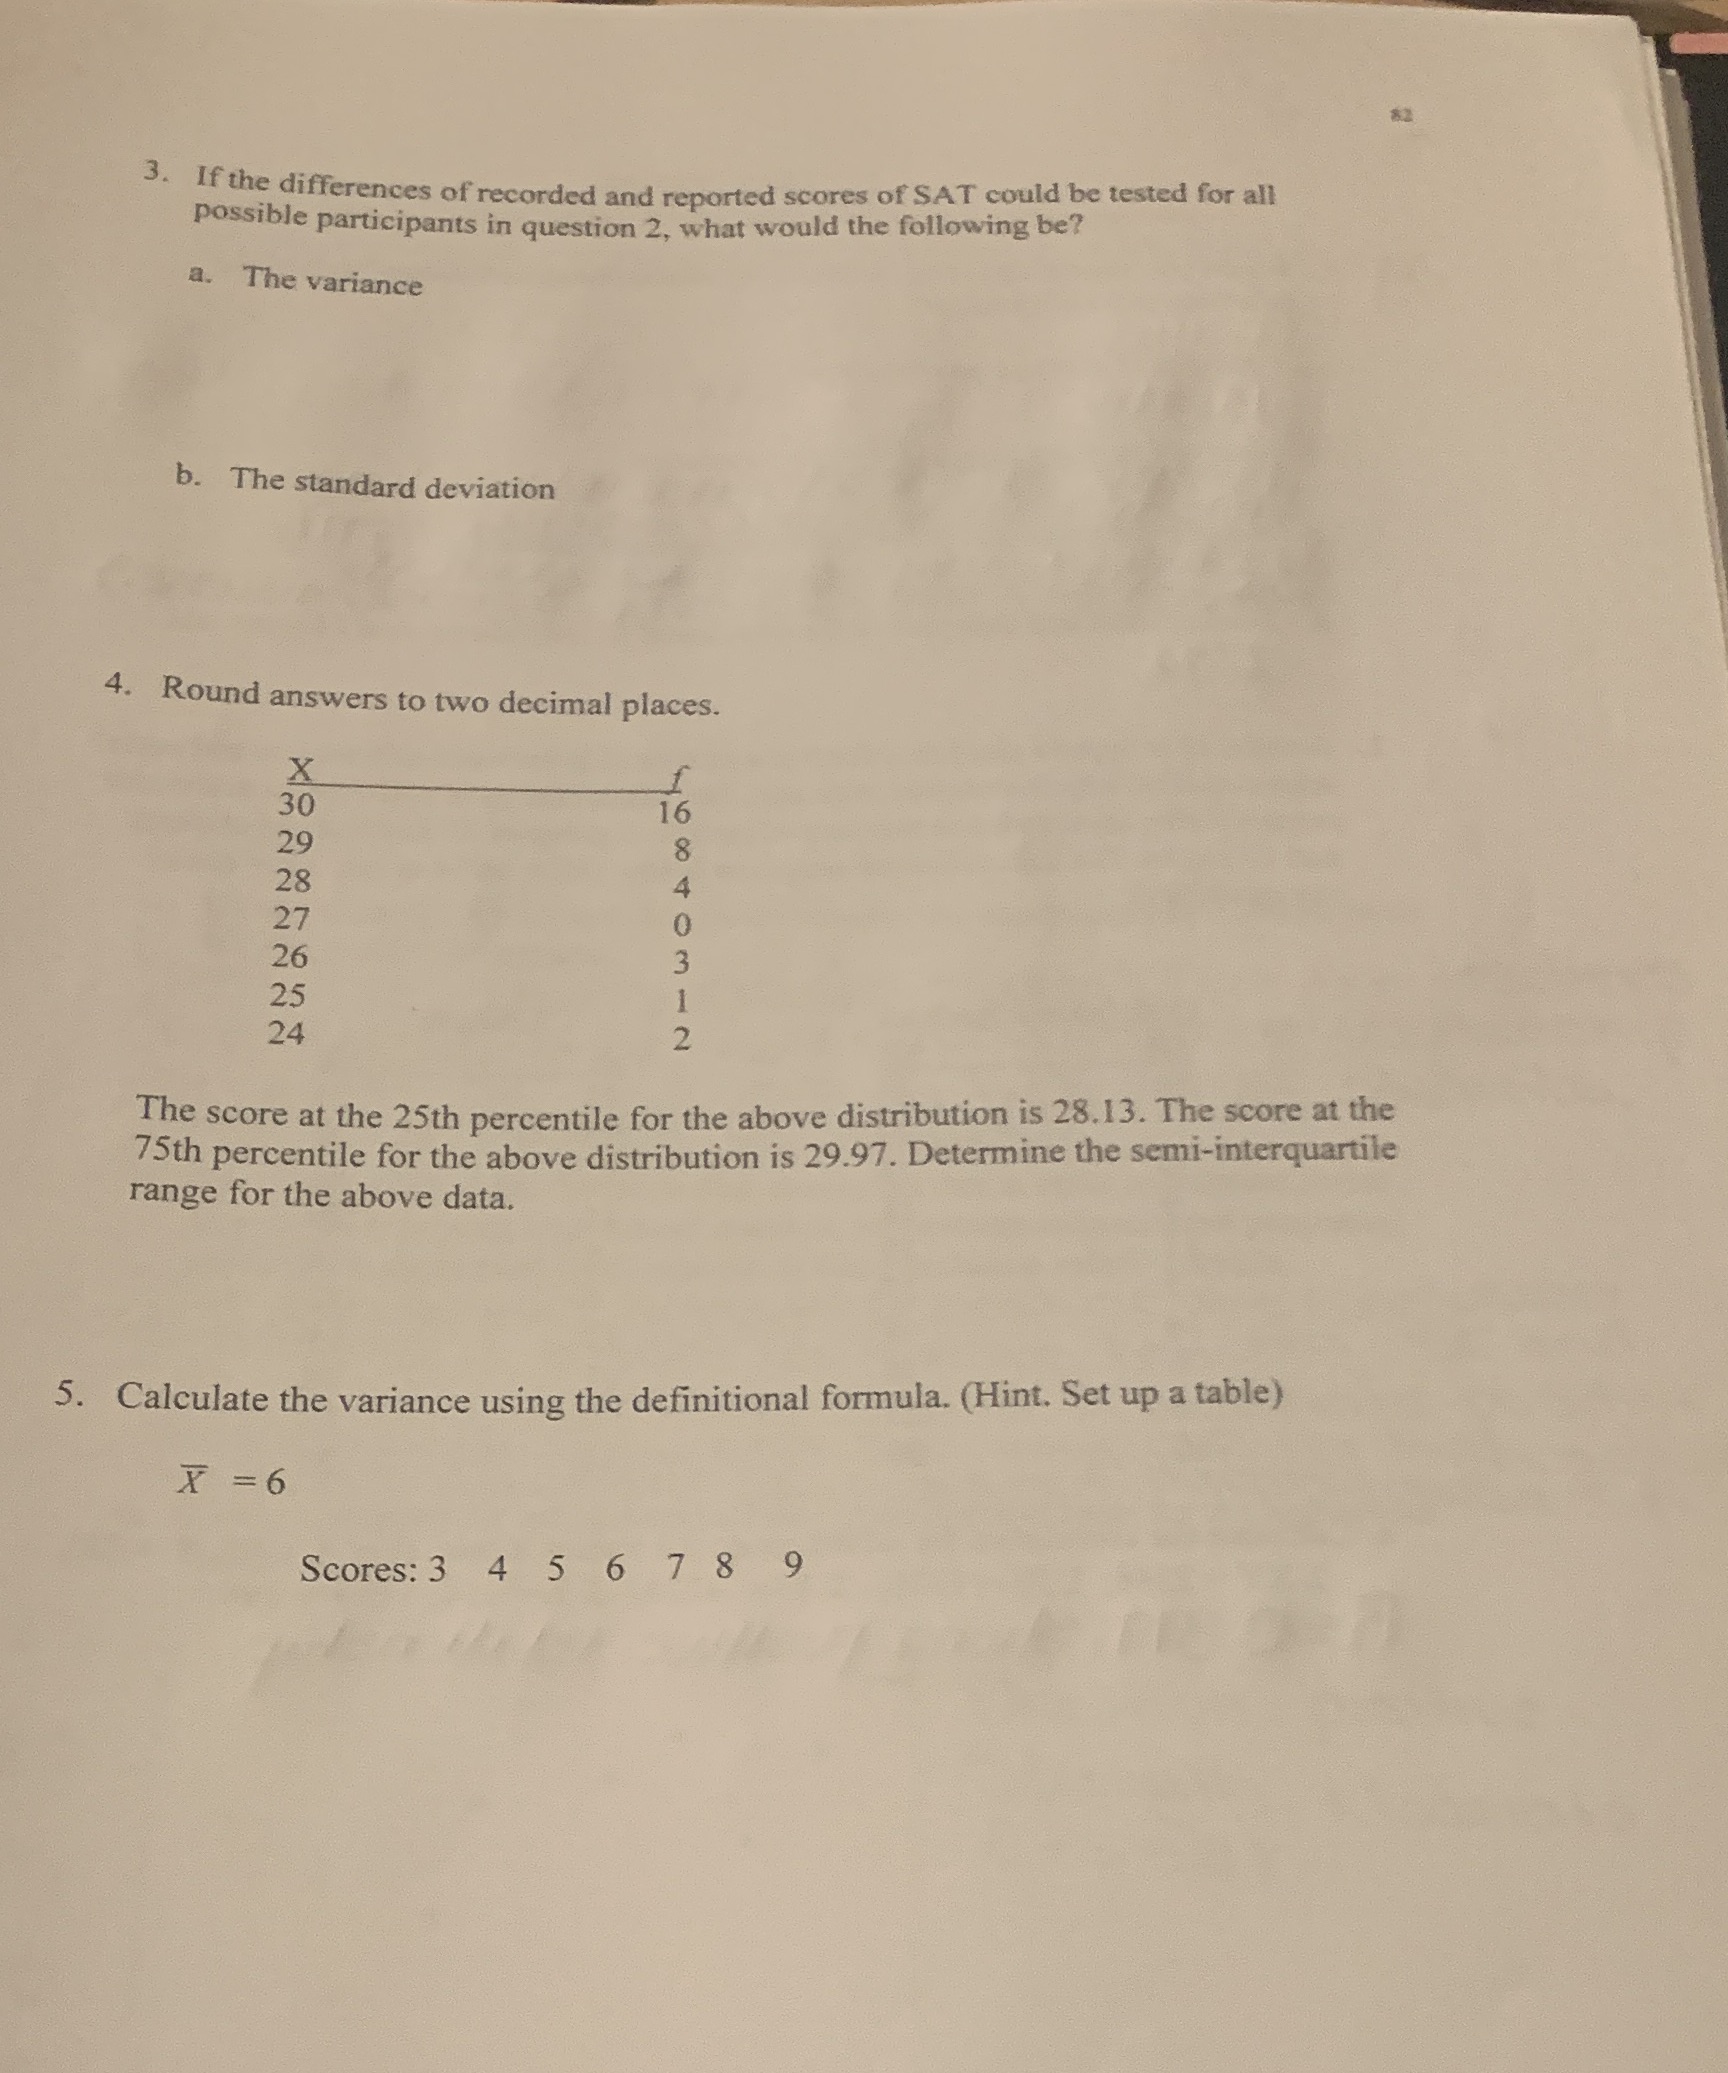
3. If the differences of recorded and reported scores of SAT could be tested for all possible participants in question 2, what would the following
Step by Step Solution
There are 3 Steps involved in it
Step: 1

Get Instant Access to Expert-Tailored Solutions
See step-by-step solutions with expert insights and AI powered tools for academic success
Step: 2

Step: 3
Ace Your Homework with AI
Get the answers you need in no time with our AI-driven, step-by-step assistance
Get Started
Beginning Algebra A Text/Workbook
Authors: Charles P McKeague
2nd Edition
1483271242, 9781483271248