In the next activity, you will need to be able to identify graphs of linear functions, calculate the slope of a linear function, write
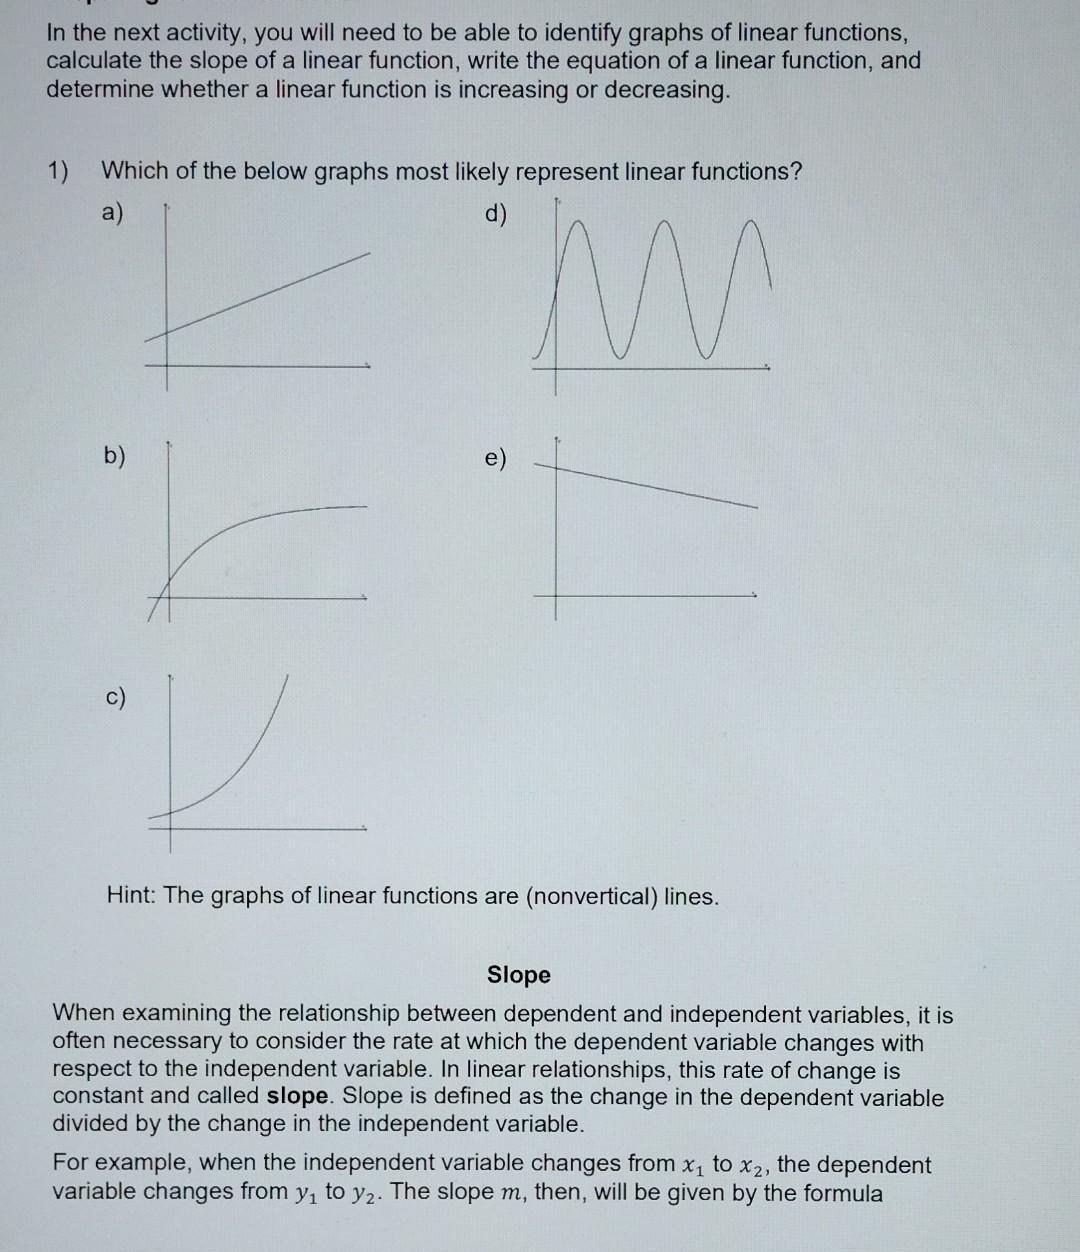
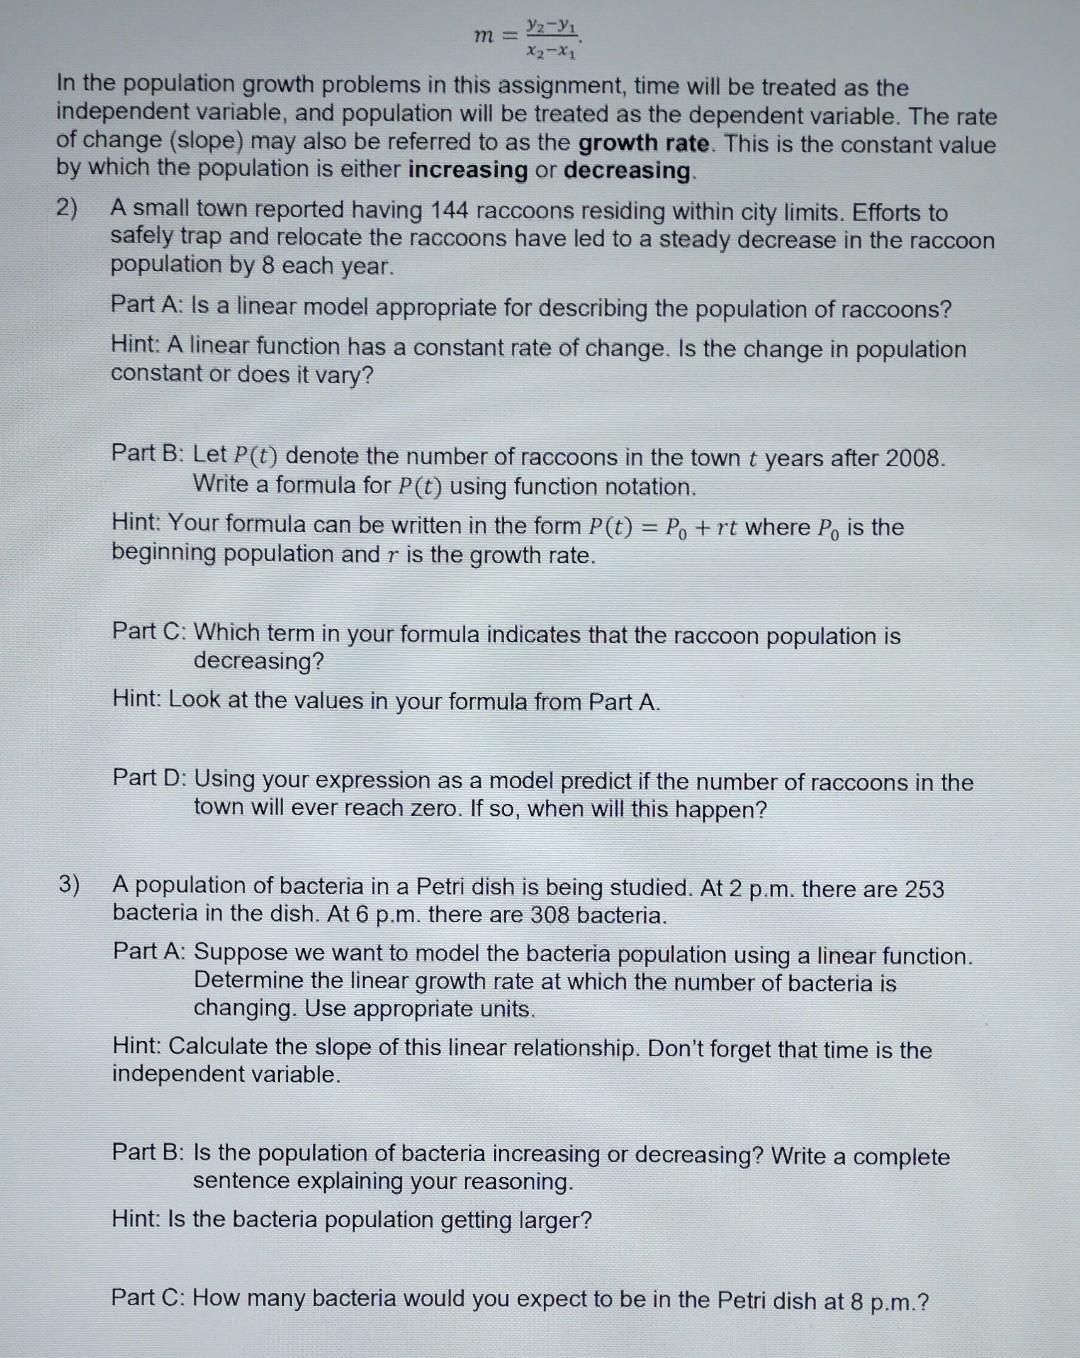
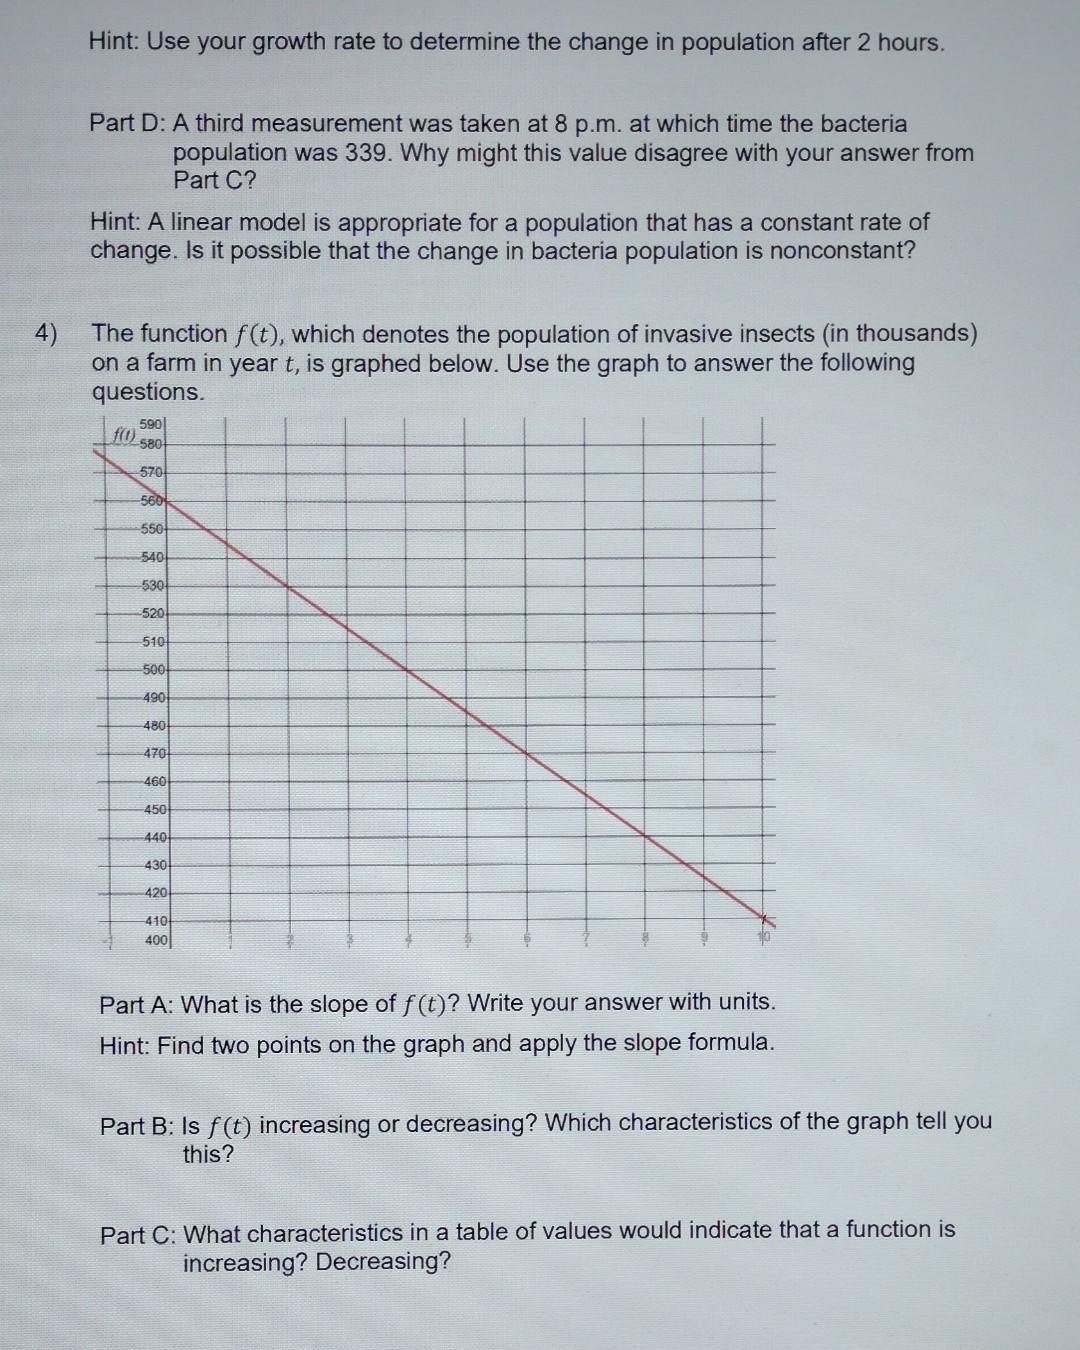
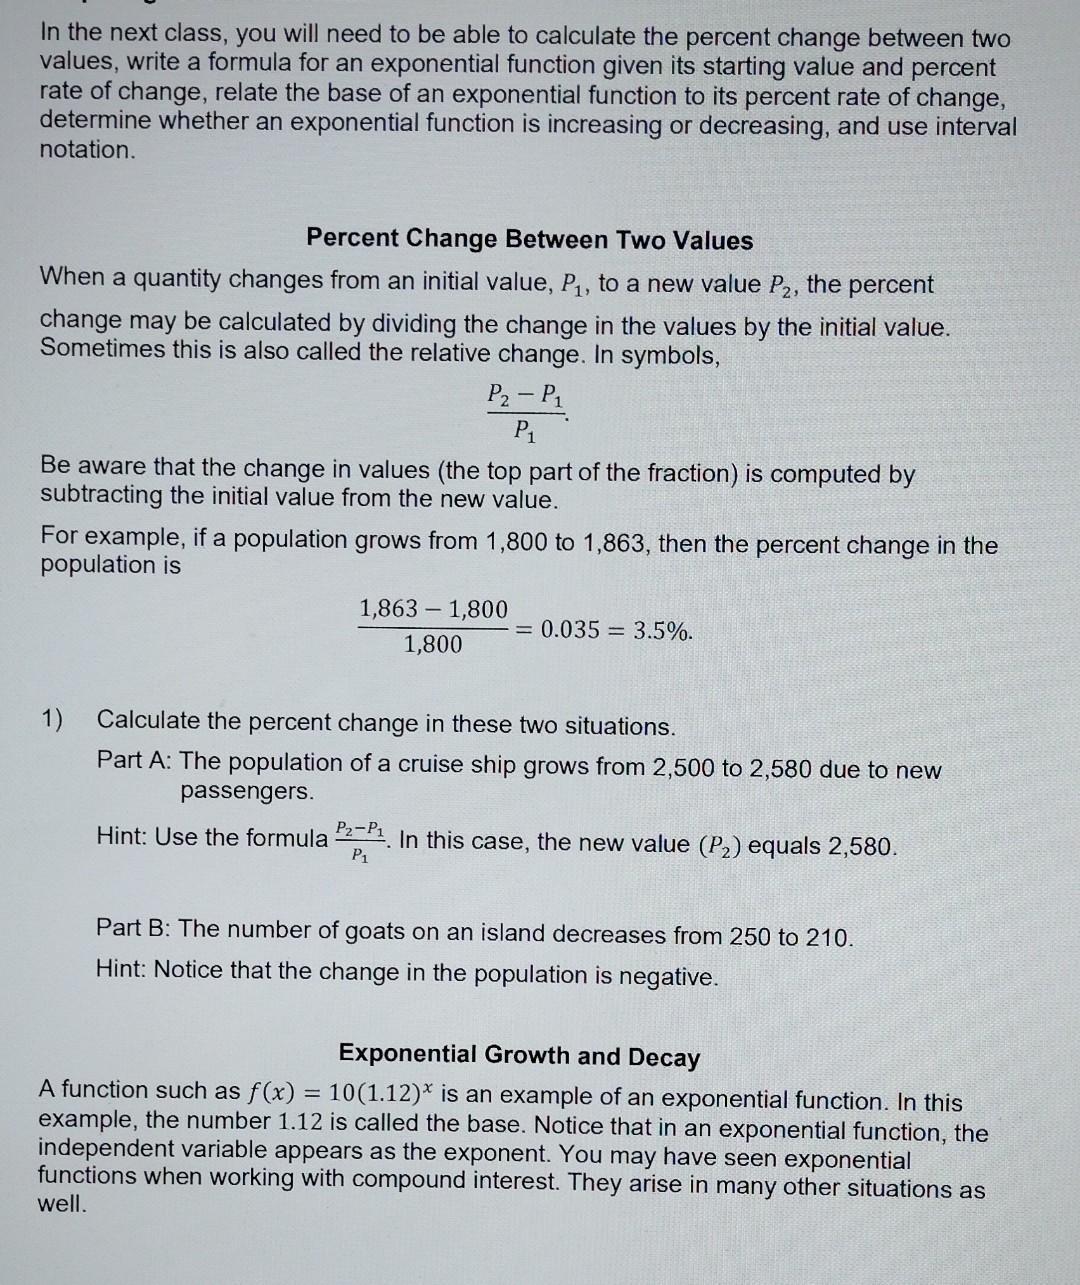
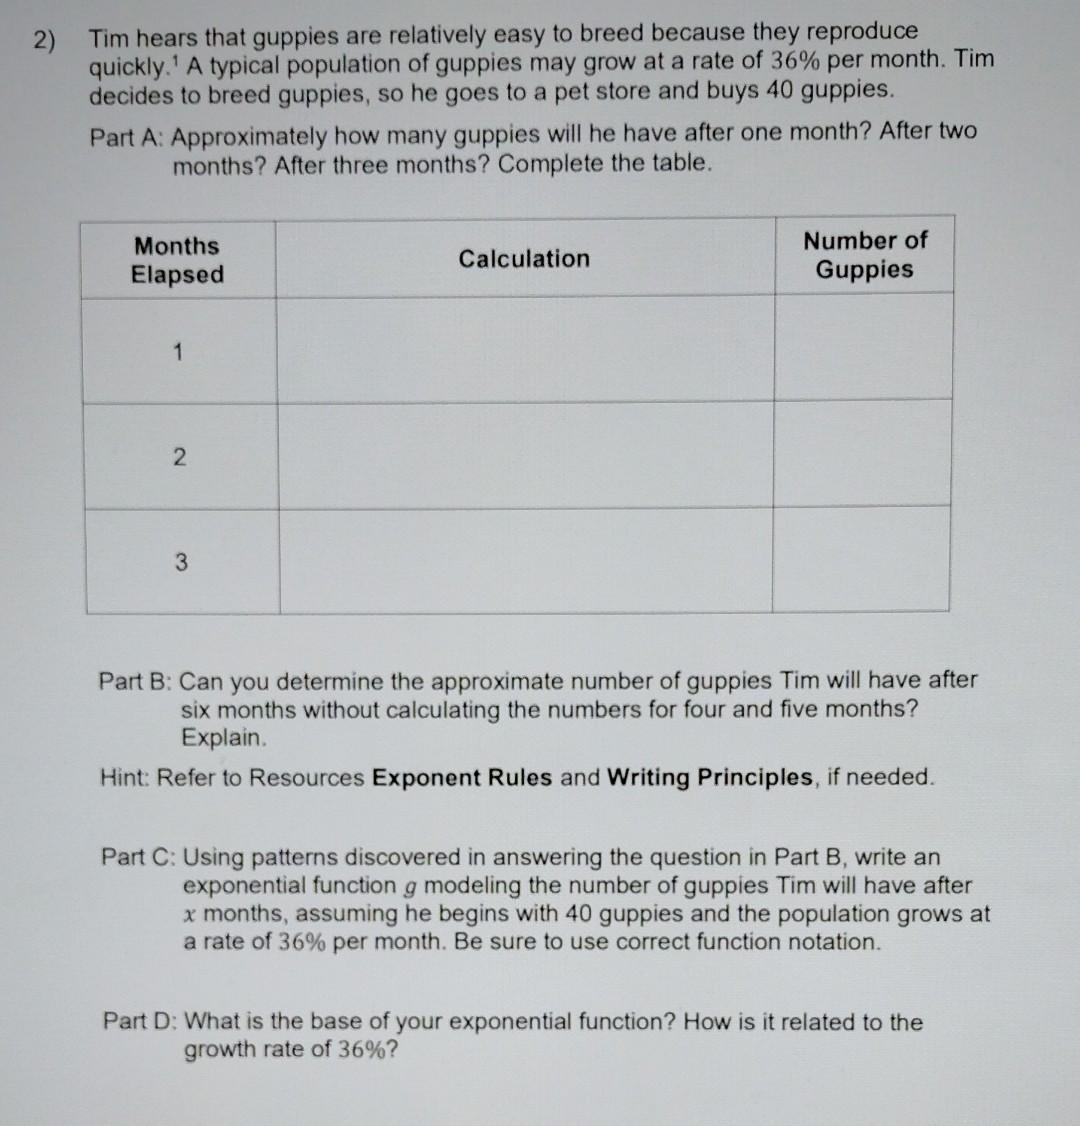
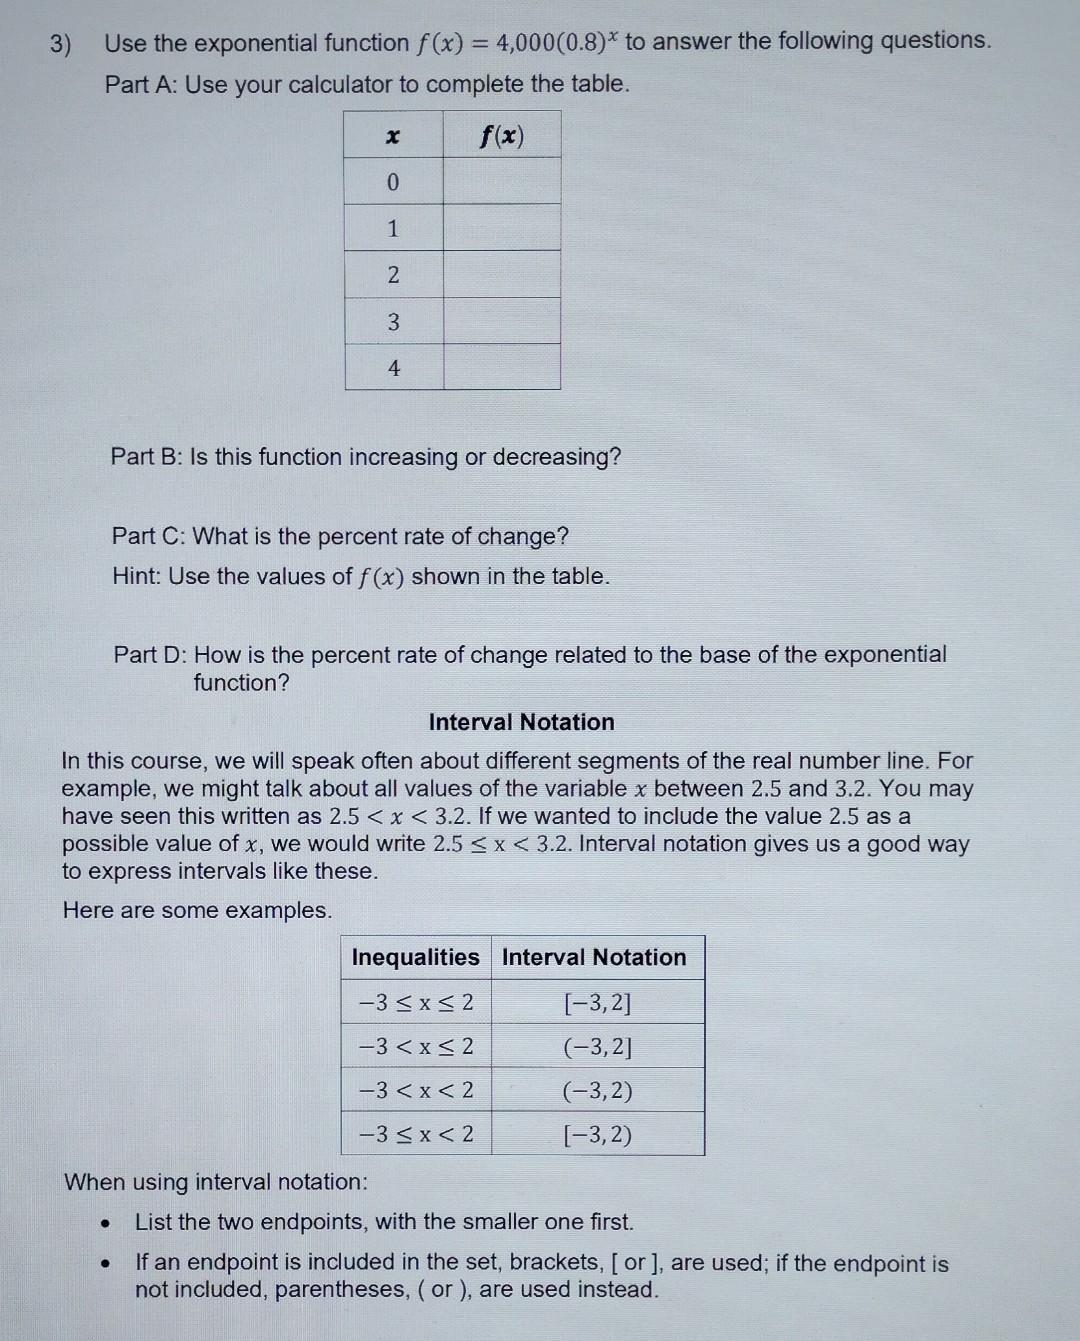
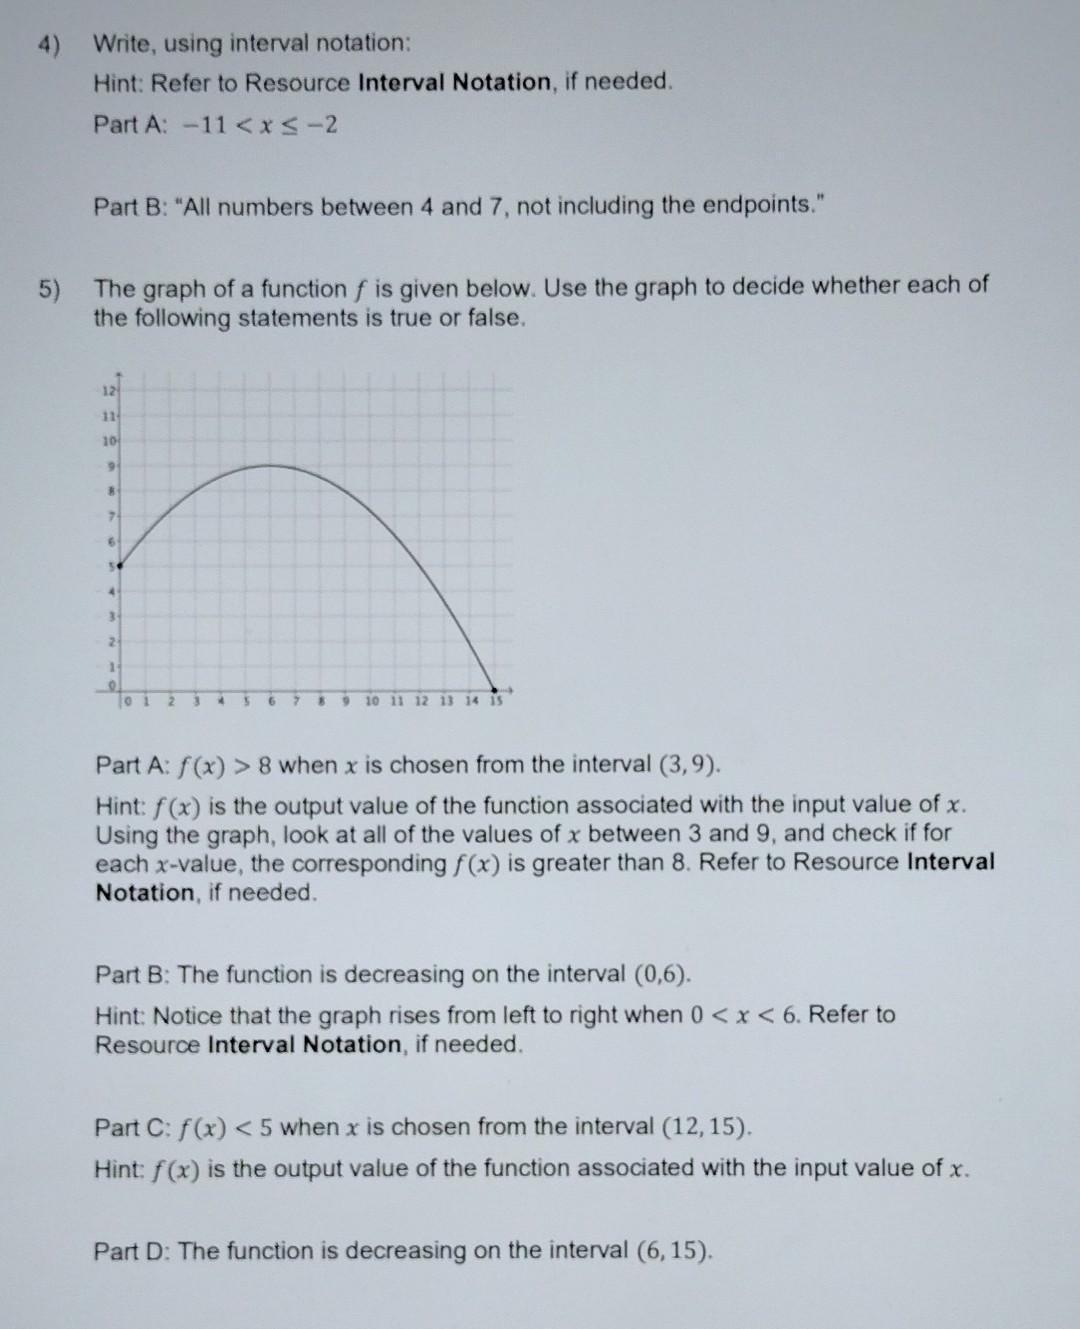

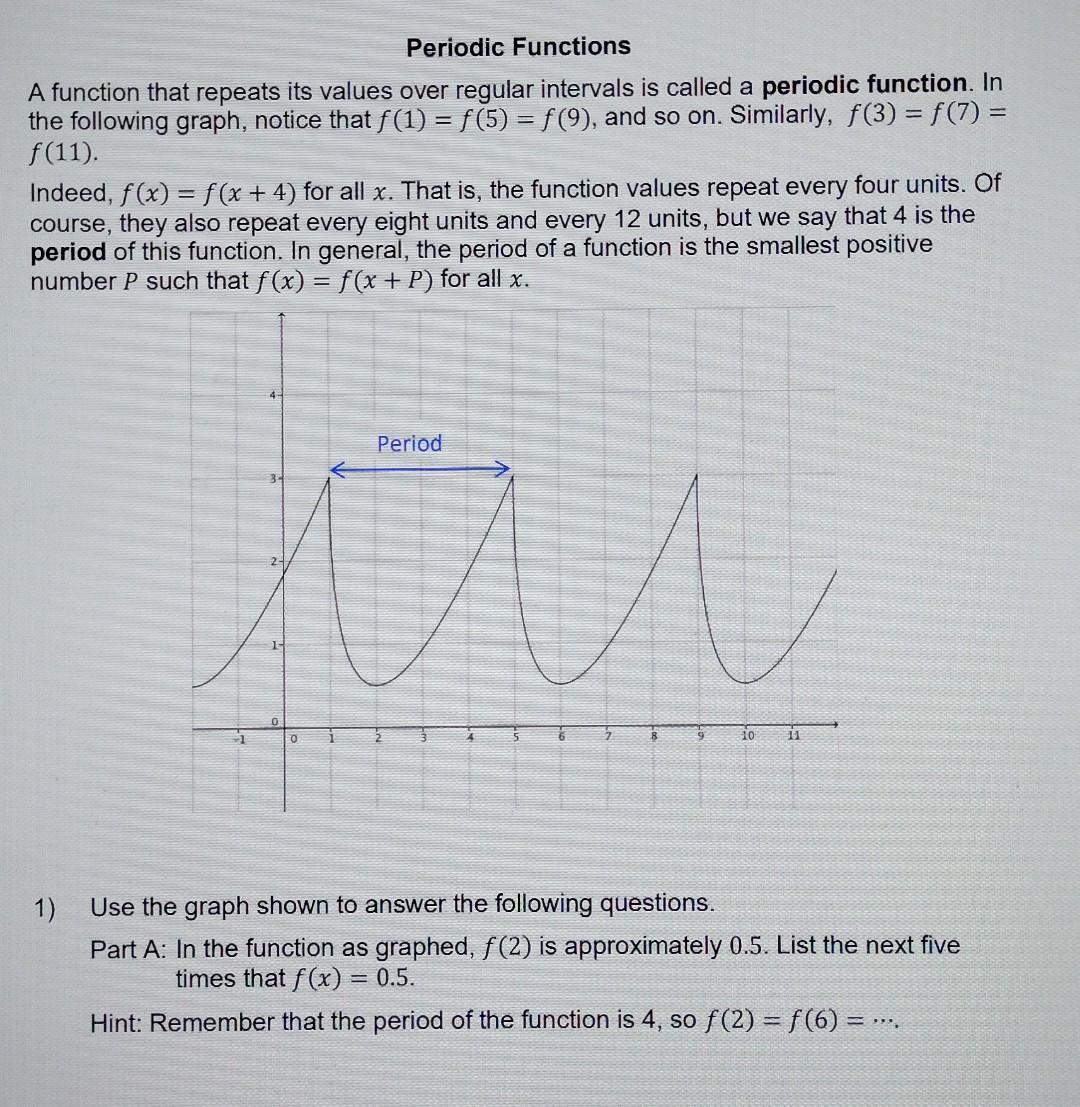
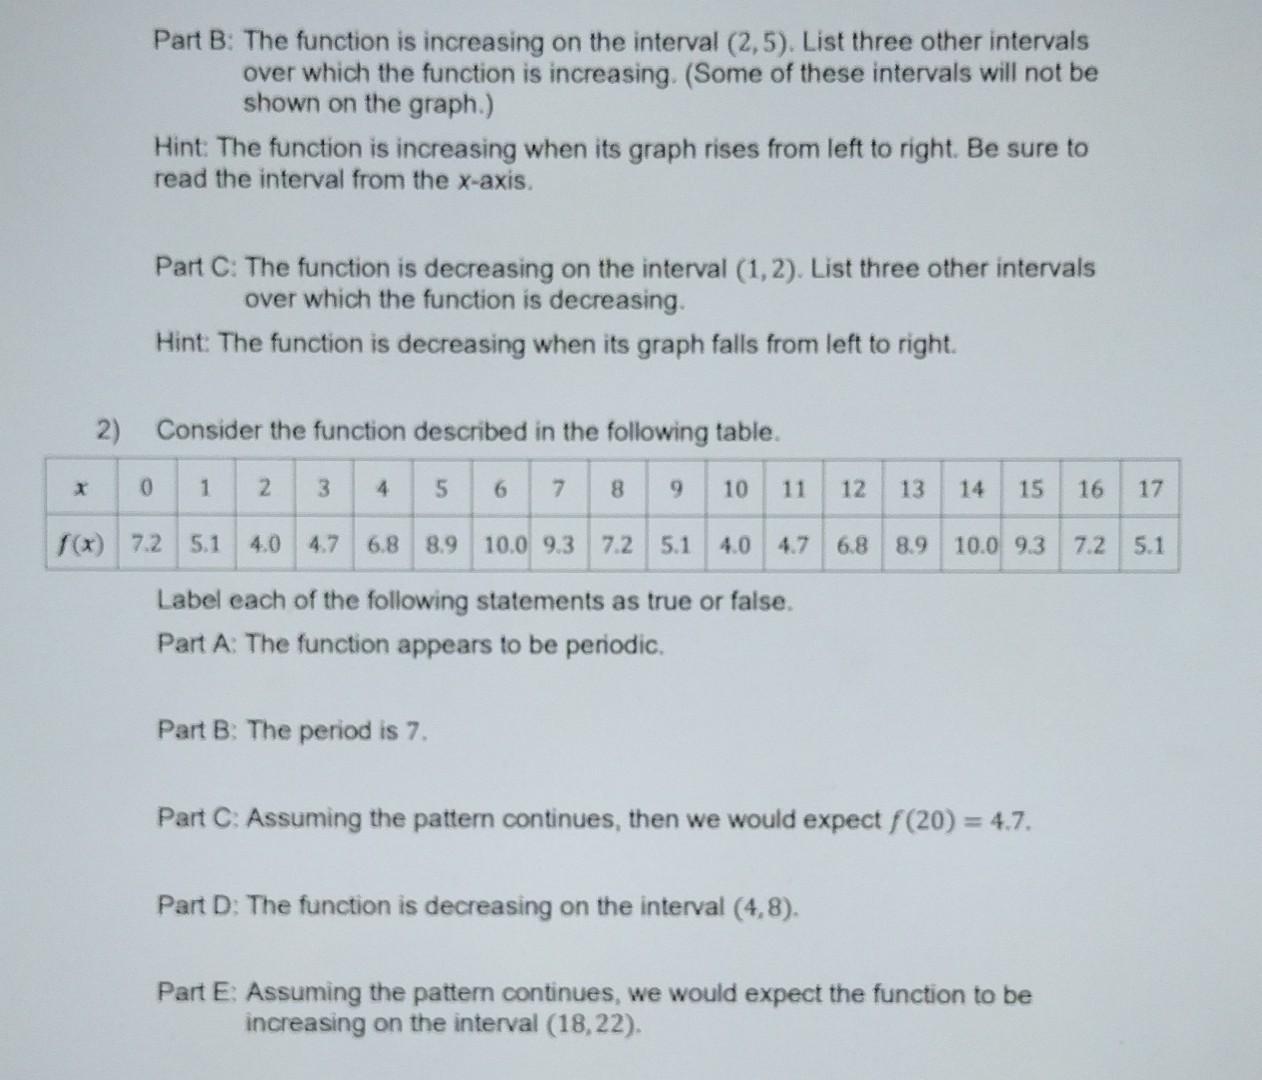
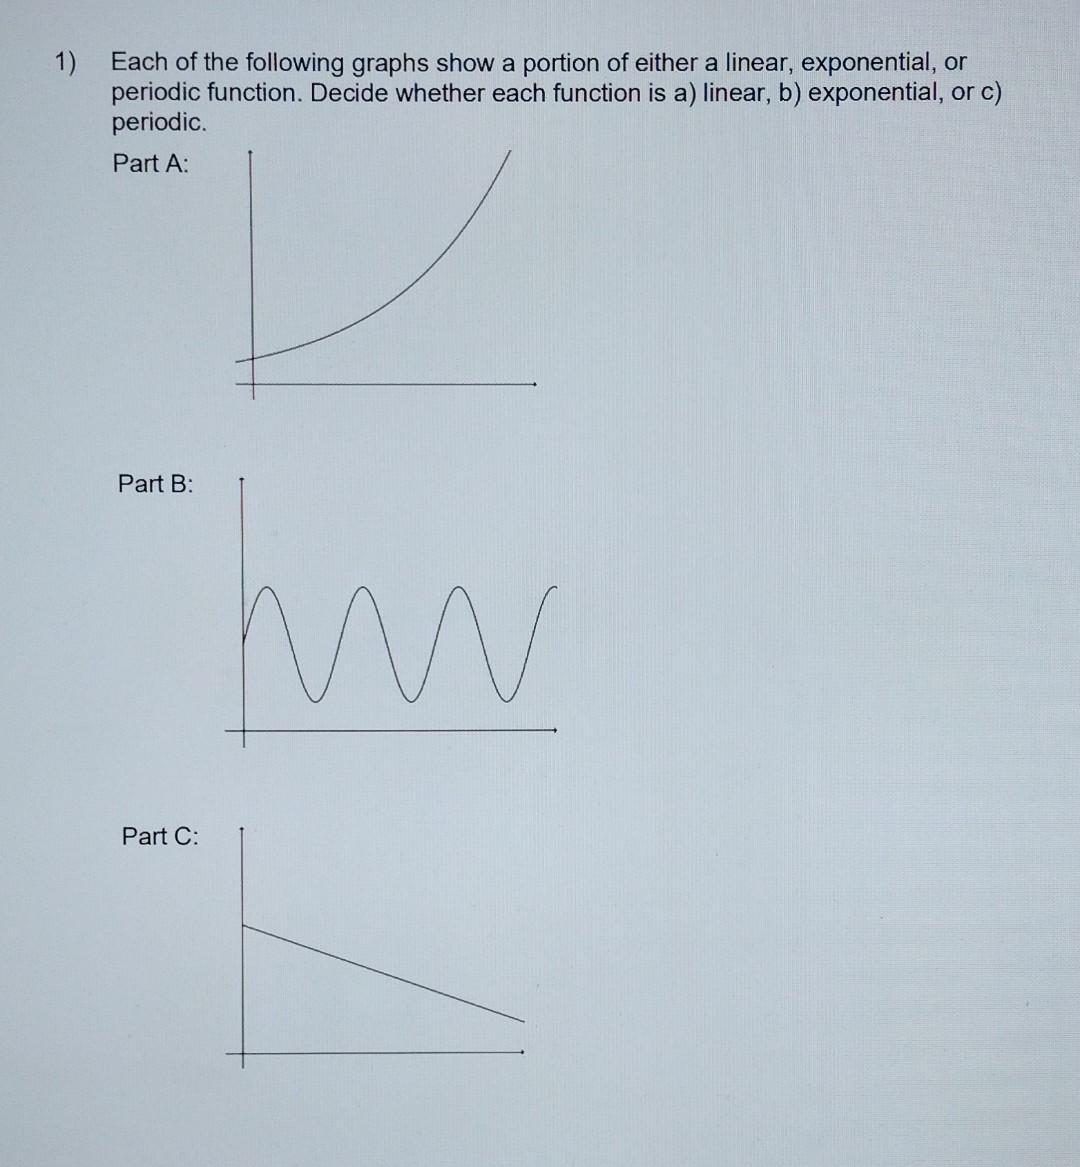
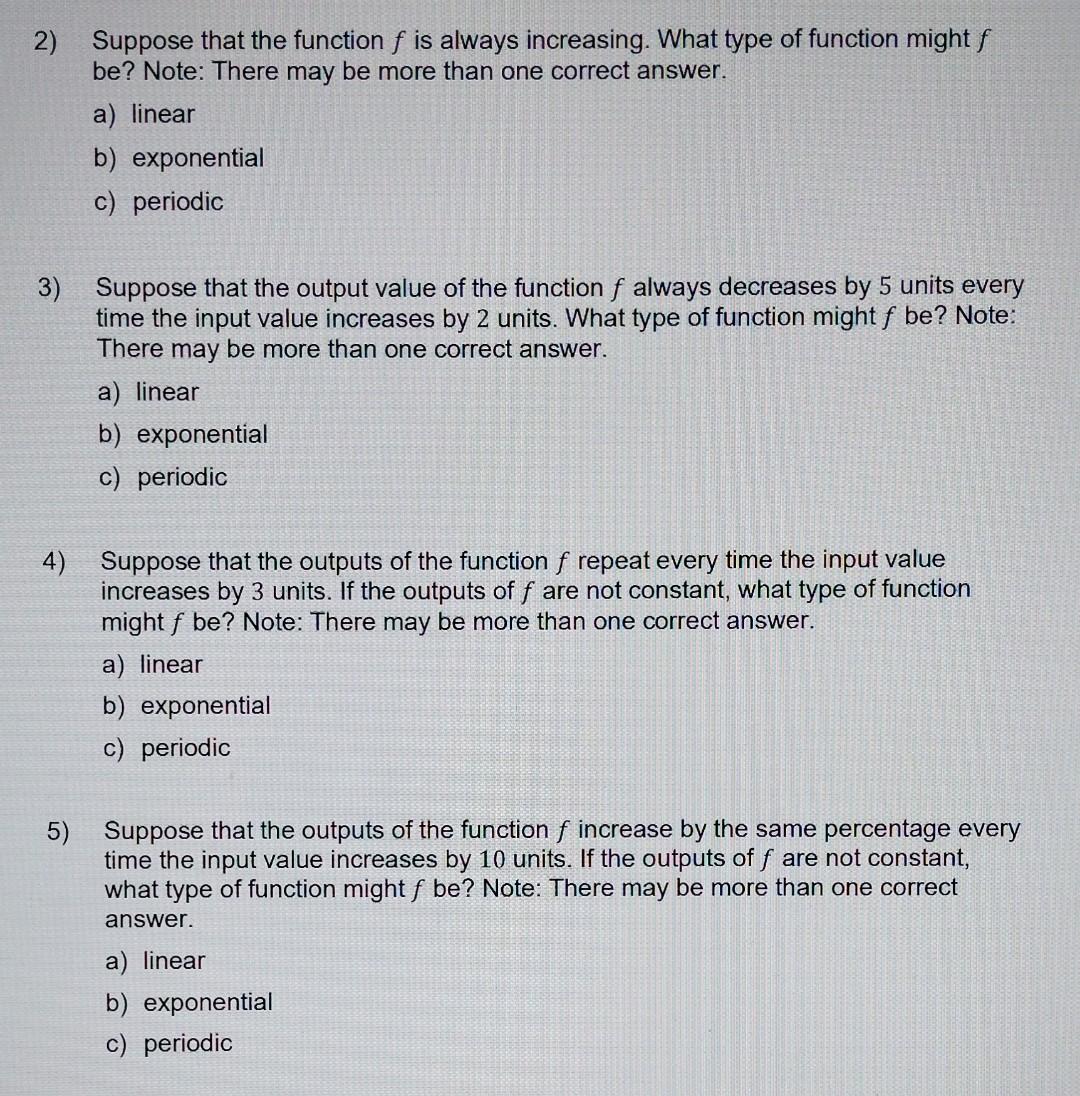
In the next activity, you will need to be able to identify graphs of linear functions, calculate the slope of a linear function, write the equation of a linear function, and determine whether a linear function is increasing or decreasing. 1) Which of the below graphs most likely represent linear functions? a) d) M b) O e) Hint: The graphs of linear functions are (nonvertical) lines. Slope When examining the relationship between dependent and independent variables, it is often necessary to consider the rate at which the dependent variable changes with respect to the independent variable. In linear relationships, this rate of change is constant and called slope. Slope is defined as the change in the dependent variable divided by the change in the independent variable. For example, when the independent variable changes from x to x2, the dependent variable changes from y to y. The slope m, then, will be given by the formula m= y2-y X2-X1 In the population growth problems in this assignment, time will be treated as the independent variable, and population will be treated as the dependent variable. The rate of change (slope) may also be referred to as the growth rate. This is the constant value by which the population is either increasing or decreasing. 2) A small town reported having 144 raccoons residing within city limits. Efforts to safely trap and relocate the raccoons have led to a steady decrease in the raccoon population by 8 each year. Part A: Is a linear model appropriate for describing the population of raccoons? Hint: A linear function has a constant rate of change. Is the change in population constant or does it vary? Part B: Let P(t) denote the number of raccoons in the town t years after 2008. Write a formula for P(t) using function notation. Hint: Your formula can be written in the form P(t) = Po + rt where Po is the beginning population and r is the growth rate. Part C: Which term in your formula indicates that the raccoon population is decreasing? Hint: Look at the values in your formula from Part A. Part D: Using your expression as a model predict if the number of raccoons in the town will ever reach zero. If so, when will this happen? 3) A population of bacteria in a Petri dish is being studied. At 2 p.m. there are 253 bacteria in the dish. At 6 p.m. there are 308 bacteria. Part A: Suppose we want to model the bacteria population using a linear function. Determine the linear growth rate at which the number of bacteria is changing. Use appropriate units. Hint: Calculate the slope of this linear relationship. Don't forget that time is the independent variable. Part B: Is the population of bacteria increasing or decreasing? Write a complete sentence explaining your reasoning. Hint: Is the bacteria population getting larger? Part C: How many bacteria would you expect to be in the Petri dish at 8 p.m.? 4) Hint: Use your growth rate to determine the change in population after 2 hours. Part D: A third measurement was taken at 8 p.m. at which time the bacteria population was 339. Why might this value disagree with your answer from Part C? Hint: A linear model is appropriate for a population that has a constant rate of change. Is it possible that the change in bacteria population is nonconstant? The function f(t), which denotes the population of invasive insects (in thousands) on a farm in year t, is graphed below. Use the graph to answer the following questions. 590 f(0) 580 570 560 550 540 530 520 510 500 490 480 470 -460 -450 440 430 420 410 400 Part A: What is the slope of f(t)? Write your answer with units. Hint: Find two points on the graph and apply the slope formula. Part B: Is f(t) increasing or decreasing? Which characteristics of the graph tell you this? Part C: What characteristics in a table of values would indicate that a function is increasing? Decreasing? Read the paragraph given below and then answer the following questions. The United States Fish and Wildlife Service regularly monitors trends in the populations of endangered species. By modeling changes in the population, they can determine if intervention is necessary for the survival of certain species. The gray wolf is a protected species, which currently resides in Minnesota, Wisconsin, and Michigan. In the late 1980s, there were approximately 1,784 gray wolves living throughout these three states. The implementation of conservation efforts has led to an increase in the gray wolf population in the three states, though they are still considered an endangered species. 5) How many gray wolves lived in Minnesota, Wisconsin, and Michigan during the late '80s? 6) What led to an increase in the gray wolf population? In the next class, you will need to be able to calculate the percent change between two values, write a formula for an exponential function given its starting value and percent rate of change, relate the base of an exponential function to its percent rate of change, determine whether an exponential function is increasing or decreasing, and use interval notation. Percent Change Between Two Values When a quantity changes from an initial value, P, to a new value P2, the percent change may be calculated by dividing the change in the values by the initial value. Sometimes this is also called the relative change. In symbols, P - P P1 Be aware that the change in values (the top part of the fraction) is computed by subtracting the initial value from the new value. For example, if a population grows from 1,800 to 1,863, then the percent change in the population is 1) 1,863 - 1,800 1,800 = 0.035 = 3.5%. Calculate the percent change in these two situations. Part A: The population of a cruise ship grows from 2,500 to 2,580 due to new passengers. Hint: Use the formula 2-. In this case, the new value (P) equals 2,580. P Part B: The number of goats on an island decreases from 250 to 210. Hint: Notice that the change in the population is negative. Exponential Growth and Decay A function such as f(x) = 10(1.12)* is an example of an exponential function. In this example, the number 1.12 is called the base. Notice that in an exponential function, the independent variable appears as the exponent. You may have seen exponential functions when working with compound interest. They arise in many other situations as well. 2) Tim hears that guppies are relatively easy to breed because they reproduce quickly. A typical population of guppies may grow at a rate of 36% per month. Tim decides to breed guppies, so he goes to a pet store and buys 40 guppies. Part A: Approximately how many guppies will he have after one month? After two months? After three months? Complete the table. Months Elapsed 1 2 3 Calculation Number of Guppies Part B: Can you determine the approximate number of guppies Tim will have after six months without calculating the numbers for four and five months? Explain. Hint: Refer to Resources Exponent Rules and Writing Principles, if needed. Part C: Using patterns discovered in answering the question in Part B, write an exponential function g modeling the number of guppies Tim will have after x months, assuming he begins with 40 guppies and the population grows at a rate of 36% per month. Be sure to use correct function notation. Part D: What is the base of your exponential function? How is it related to the growth rate of 36%? 3) Use the exponential function f(x) = 4,000(0.8)* to answer the following questions. Part A: Use your calculator to complete the table. f(x) x 0 1 2 Part B: Is this function increasing or decreasing? 3 4 Part C: What is the percent rate of change? Hint: Use the values of f(x) shown in the table. Interval Notation In this course, we will speak often about different segments of the real number line. For example, we might talk about all values of the variable x between 2.5 and 3.2. You may have seen this written as 2.5 < x < 3.2. If we wanted to include the value 2.5 as a possible value of x, we would write 2.5 < x < 3.2. Interval notation gives us a good way ress intervals like these. to Here are some examples. When using interval notation: Part D: How is the percent rate of change related to the base of the exponential function? Inequalities Interval Notation -3 x2 -3 4) Write, using interval notation: Hint: Refer to Resource Interval Notation, if needed. Part A: -11 < x < -2 Part B: "All numbers between 4 and 7, not including the endpoints." 5) The graph of a function f is given below. Use the graph to decide whether each of the following statements is true or false. 12 11 10 91 7 6 54 4 3 2 1 01 2 3 4 S 6 7 9 10 11 12 13 14 15 Part A: f(x) > 8 when x is chosen from the interval (3,9). Hint: f(x) is the output value of the function associated with the input value of x. Using the graph, look at all of the values of x between 3 and 9, and check if for each x-value, the corresponding f(x) is greater than 8. Refer to Resource Interval Notation, if needed. Part B: The function is decreasing on the interval (0,6). Hint: Notice that the graph rises from left to right when 0 < x < 6. Refer to Resource Interval Notation, if needed. Part C: f(x) < 5 when x is chosen from the interval (12, 15). Hint: f(x) is the output value of the function associated with the input value of x. Part D: The function is decreasing on the interval (6, 15). 6) Write down one or two questions you want to ask in class in order to better understand how to use interval notation. Periodic Functions A function that repeats its values over regular intervals is called a periodic function. In the following graph, notice that f(1) = f(5) = f(9), and so on. Similarly, f(3) = f(7) = f(11). Indeed, f(x) = f(x + 4) for all x. That is, the function values repeat every four units. Of course, they also repeat every eight units and every 12 units, but we say that 4 is the period of this function. In general, the period of a function is the smallest positive number P such that f(x) = f(x + P) for all x. -1 2- 0 0 Period 10 11 1) Use the graph shown to answer the following questions. Part A: In the function as graphed, f(2) is approximately 0.5. List the next five times that f(x) = 0.5. Hint: Remember that the period of the function is 4, so f(2)= f(6) = . X Part B: The function is increasing on the interval (2,5). List three other intervals over which the function is increasing. (Some of these intervals will not be shown on the graph.) 2) Hint: The function is increasing when its graph rises from left to right. Be sure to read the interval from the x-axis. Consider the function described in the following table. 0 1 3 4 5 6 7 8 9 10 11 12 13 14 15 16 17 f(x) 7.2 5.1 4.0 4.7 6.8 8.9 10.0 9.3 7.2 5.1 4.0 4.7 6.8 8.9 10.0 9.3 7.2 5.1 Label each of the following statements as true or false. Part A: The function appears to be periodic. Part C: The function is decreasing on the interval (1, 2). List three other intervals over which the function is decreasing. Hint: The function is decreasing when its graph falls from left to right. 2 Part B: The period is 7. Part C: Assuming the pattern continues, then we would expect f(20) = 4.7. Part D: The function is decreasing on the interval (4,8). Part E: Assuming the pattern continues, we would expect the function to be increasing on the interval (18,22). 1) Each of the following graphs show a portion of either a linear, exponential, or periodic function. Decide whether each function is a) linear, b) exponential, or c) periodic. Part A: Part B: Part C: ww 2) 3) Suppose that the function f is always increasing. What type of function might f be? Note: There may be more than one correct answer. a) linear b) exponential c) periodic Suppose that the output value of the function f always decreases by 5 units every time the input value increases by 2 units. What type of function might f be? Note: There may be more than one correct answer. a) linear b) exponential c) periodic 4) Suppose that the outputs of the function f repeat every time the input value increases by 3 units. If the outputs of f are not constant, what type of function might f be? Note: There may be more than one correct answer. a) linear b) exponential c) periodic 5) Suppose that the outputs of the function f increase by the same percentage every time the input value increases by 10 units. If the outputs of f are not constant, what type of function might f be? Note: There may be more than one correct answer. a) linear b) exponential c) periodic
Step by Step Solution
3.41 Rating (160 Votes )
There are 3 Steps involved in it
Step: 1
Among these graphs a and e represents linear functions Equation of these graphs ...
See step-by-step solutions with expert insights and AI powered tools for academic success
Step: 2

Step: 3

Ace Your Homework with AI
Get the answers you need in no time with our AI-driven, step-by-step assistance
Get Started


