

Answered step by step
Verified Expert Solution
Question
1 Approved Answer
3 IMPLEMENT LOGISTIC REGRESSION USING MATLAB Create a 1 0 0 0 4 Design Matrix by making a column of 1 ' s ( in
IMPLEMENT LOGISTIC REGRESSION USING MATLAB
Create a Design Matrix by making a column of s in the first column followed by the
three columns of data, you can call this full.
There is no need to shuffle this dataset, since it was generated using a random approach.
Separate the design matrix, full, and desired vector, into training and testing subsets:
xtrain, ytrain Xtest, ytest
You will implement gradient descent to find the optimal weights, w w w w
As you know, gradient descent involves the iteration:
vecvec
In this case and hat To find the gradient, you'll need to apply the
chain rule a few times. Note that
You will find it convenient to define the functions:
Compute the sigmoid of a scalar or vector
function sigmoid
Compute the derivative of the sigmoid, for a scalar,
function dsigmoid
even though these are both fairly simple functions. It is very easy for your code complexity to
get out of hand.a You should initialize your gradient descent by picking random values for the weight vector,
vec
b You will iterate through some number, NUMEPOCHS, of epochs. You can try
NUMEPOCHS
c Each epoch will involve iterating through each row of train. For each row compute
hat and hat
and then apply the gradient update. You can start with and adjust up or down as
you see fit.
At the end of each epoch, you can easily compute the vector of training and testing errors,
and training and testing loss, eg for training:
vecvecvecvec
where produces a vector valued result of a vector valued argument
Record the training and testing loss for each epoch, and plot that during or after training.
The training lost must decrease monotonically ie without ever increasing If it does not,
you have a bug in your code.
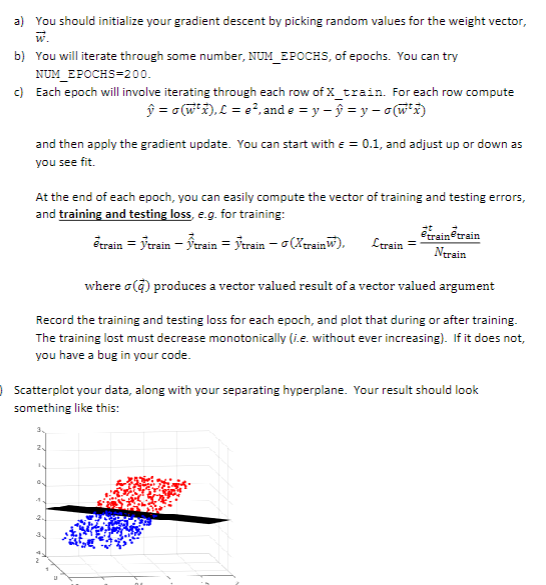
Scatterplot your data, along with your separating hyperplane. Your result should look
something like this:
Heres some plotting code to help:
figure
xgrd ygrd meshgrid::; Generate x and y data for the plane
z zerossizexgrd; Generate z data for the plane
for row :sizexgrd
for col :sizexgrd
zrowcolw wxgrdrowcol wygrdrowcolw;
end
end
Plot random data points with desired classes
scatterXtrain: Xtrain : Xtrain :
y zeroslengthyy "filled"
hold
surfxgrd ygrd z Plot the plane, if perfect training should
separate the classes, may not be this is what i have thus far : PART : GENERATE TWOCLASS PSEUDORANDOM DATA IN DIMENSIONS
Assuming student ID digits are already defined as dig dig dig dig
dig; Example digit
dig; Example digit
dig; Example digit
dig; Example digit must not be
Generate the u vector as per instructions
u dig dig dig dig;
Initialize matrices to store data points and classes
arr zeros;
y zeros;
Generate data points
for i :
Generate x and y randomly between and
x rand;
ypoint rand;
Solve for z using the plane equation
z u ux uypoint u;
Generate a random deviation
deviation rand;
Find the final coordinates of the point
arri :) x ypoint z deviation u:;
Assign class based on the deviation
yi deviation ;
end
PART : IMPLEMENT LOGISTIC REGRESSION USING MATLAB
Create the design matrix
Xfull ones arr;
Step by Step Solution
There are 3 Steps involved in it
Step: 1

Get Instant Access to Expert-Tailored Solutions
See step-by-step solutions with expert insights and AI powered tools for academic success
Step: 2

Step: 3
Ace Your Homework with AI
Get the answers you need in no time with our AI-driven, step-by-step assistance
Get Started
Sql All In One For Dummies 7 Books In One
Authors: Allen G Taylor ,Richard Blum
4th Edition
1394242298, 978-1394242290