Answered step by step
Verified Expert Solution
Question
1 Approved Answer
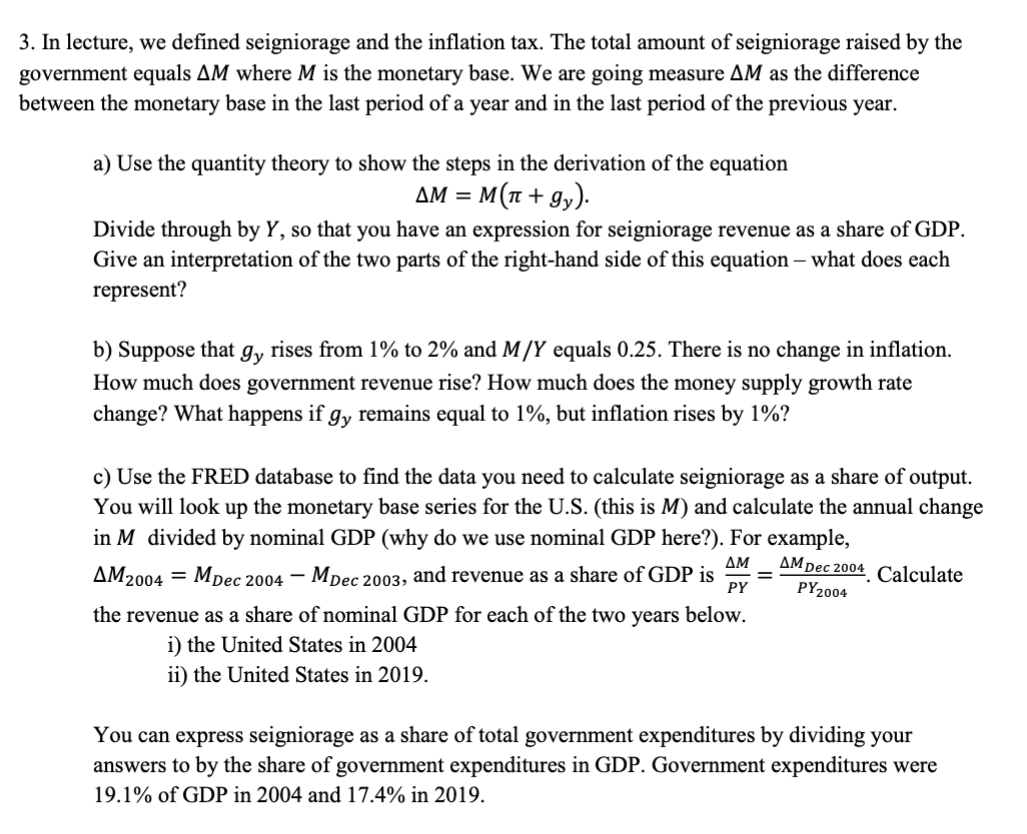
3. In lecture, we defined seigniorage and the inflation tax. The total amount of seigniorage raised by the government equals AM where M is

3. In lecture, we defined seigniorage and the inflation tax. The total amount of seigniorage raised by the government equals AM where M is the monetary base. We are going measure AM as the difference between the monetary base in the last period of a year and in the last period of the previous year. a) Use the quantity theory to show the steps in the derivation of the equation AM = M( + gy). Divide through by Y, so that you have an expression for seigniorage revenue as a share of GDP. Give an interpretation of the two parts of the right-hand side of this equation - what does each represent? b) Suppose that gy rises from 1% to 2% and M/Y equals 0.25. There is no change in inflation. How much does government revenue rise? How much does the money supply growth rate change? what happens if gy remains equal to 1%, but inflation rises by 1%? c) Use the FRED database to find the data you need to calculate seigniorage as a share of output. You will look up the monetary base series for the U.S. (this is M) and calculate the annual change in M divided by nominal GDP (why do we use nominal GDP here?). For example, AM Dec 2004 Calculate AM2004 = MDec 2004- MDec 2003, and revenue as a share of GDP is = PY2004 PY the revenue as a share of nominal GDP for each of the two years below. i) the United States in 2004 ii) the United States in 2019. You can express seigniorage as a share of total government expenditures by dividing your answers to by the share of government expenditures in GDP. Government expenditures were 19.1% of GDP in 2004 and 17.4% in 2019.
Step by Step Solution
There are 3 Steps involved in it
Step: 1
3 a Okay here are the steps Using the quantity theory of money MV PY Where M is the money supply V i...
Get Instant Access to Expert-Tailored Solutions
See step-by-step solutions with expert insights and AI powered tools for academic success
Step: 2

Step: 3

Ace Your Homework with AI
Get the answers you need in no time with our AI-driven, step-by-step assistance
Get Started


