Answered step by step
Verified Expert Solution
Question
1 Approved Answer
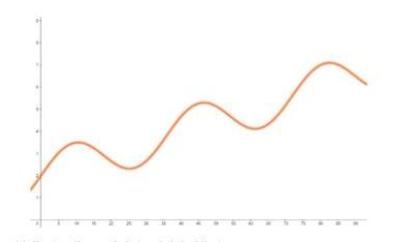
3. Jules keeps a record of how many hours of load-shedding he experiences each day. He finds that the function below, and its graph,


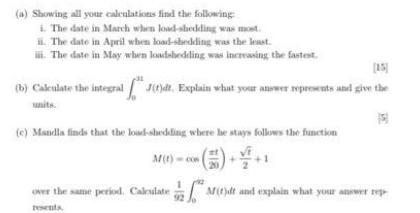
3. Jules keeps a record of how many hours of load-shedding he experiences each day. He finds that the function below, and its graph, gives the load-shedding in hours/day over the months from March to May 2023, where t is measured in days and t = 0 coincides with midnight at the beginning of 1 March 2023. J(t)=sin( ++ (a) Showing all your calculations find the following: i. The date in March when load-shedding was most ii. The date in April when load-shedding was the least. iii. The date in May when loadshedding was increasing the fastest. (b) Calculate the integral (1)dt. Explain what your answer represents and give the units (c) Mandla finds that the load-shedding where he stays follows the function 15 M(t)-con ()+++ over the same period, Calculate Mdt and explain what your answer rep
Step by Step Solution
There are 3 Steps involved in it
Step: 1

Get Instant Access to Expert-Tailored Solutions
See step-by-step solutions with expert insights and AI powered tools for academic success
Step: 2

Step: 3

Ace Your Homework with AI
Get the answers you need in no time with our AI-driven, step-by-step assistance
Get Started


