Answered step by step
Verified Expert Solution
Question
1 Approved Answer
3. Let's do something interesting with MATLAB. Your task right now is using MATLAB to plot a US flag. (10 points) At the end of
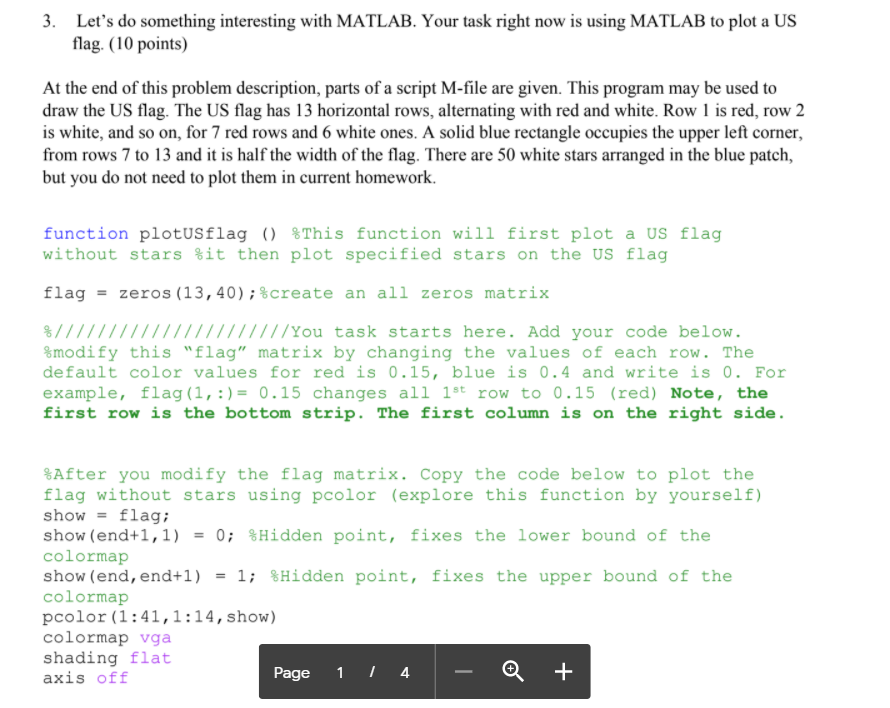
3. Let's do something interesting with MATLAB. Your task right now is using MATLAB to plot a US flag. (10 points) At the end of this problem description, parts of a script M-file are given. This program may be used to draw the US flag. The US flag has 13 horizontal rows, alternating with red and white. Row 1 is red, row 2 is white, and so on, for 7 red rows and 6 white ones. A solid blue rectangle occupies the upper left corner, from rows 7 to 13 and it is half the width of the flag. There are 50 white stars arranged in the blue patch, but you do not need to plot them in current homework. function plotusflag () This function will first plot a US flag without stars fit then plot specified stars on the US flag flag = zeros (13,40); $create an all zeros matrix %/11/11 17/11////You task starts here. Add your code below. &modify this "flag" matrix by changing the values of each row. The default color values for red is 0.15, blue is 0.4 and write is 0. For example, flag (1, :) = 0.15 changes all 1st row to 0.15 (red) Note, the first row is the bottom strip. The first column is on the right side. %After you modify the flag matrix. Copy the code below to plot the flag without stars using pcolor (explore this function by yourself) show = flag; show (end+1, 1) = 0; Hidden point, fixes the lower bound of the colormap show (end, end+1) 1; &Hidden point, fixes the upper bound of the colormap pcolor (1:41,1:14, show) colormap vga shading flat axis off Page 1 T 4 Q +
Step by Step Solution
There are 3 Steps involved in it
Step: 1
Get Instant Access to Expert-Tailored Solutions
See step-by-step solutions with expert insights and AI powered tools for academic success
Step: 2
Step: 3
Ace Your Homework with AI
Get the answers you need in no time with our AI-driven, step-by-step assistance
Get Started