

Question
3. Madhu wants to clarify the purpose of the chart and focus on the areas containing data. Use Break-Even Point as the chart title. Change
3. Madhu wants to clarify the purpose of the chart and focus on the areas containing data. Use Break-Even Point as the chart title. Change the Minimum bound of the horizontal axis to 2,500 and let the Maximum bound adjust automatically. Change the Minimum bound of the vertical axis to 2,000,000 and let the Maximum bound adjust automatically.
4. Madhu also wants to examine how varying sales price and volume affects net income from wind turbines. She has already entered the net income in cell E18 and sales prices in the range F18:J18. For the range E18:J27, create a two-variable data table using the price per unit (cell C6) as the Row input cell and the units sold (cell C5) as the Column input cell. In cell E18, create a custom number format that displays "Units Sold" instead of the net income value.
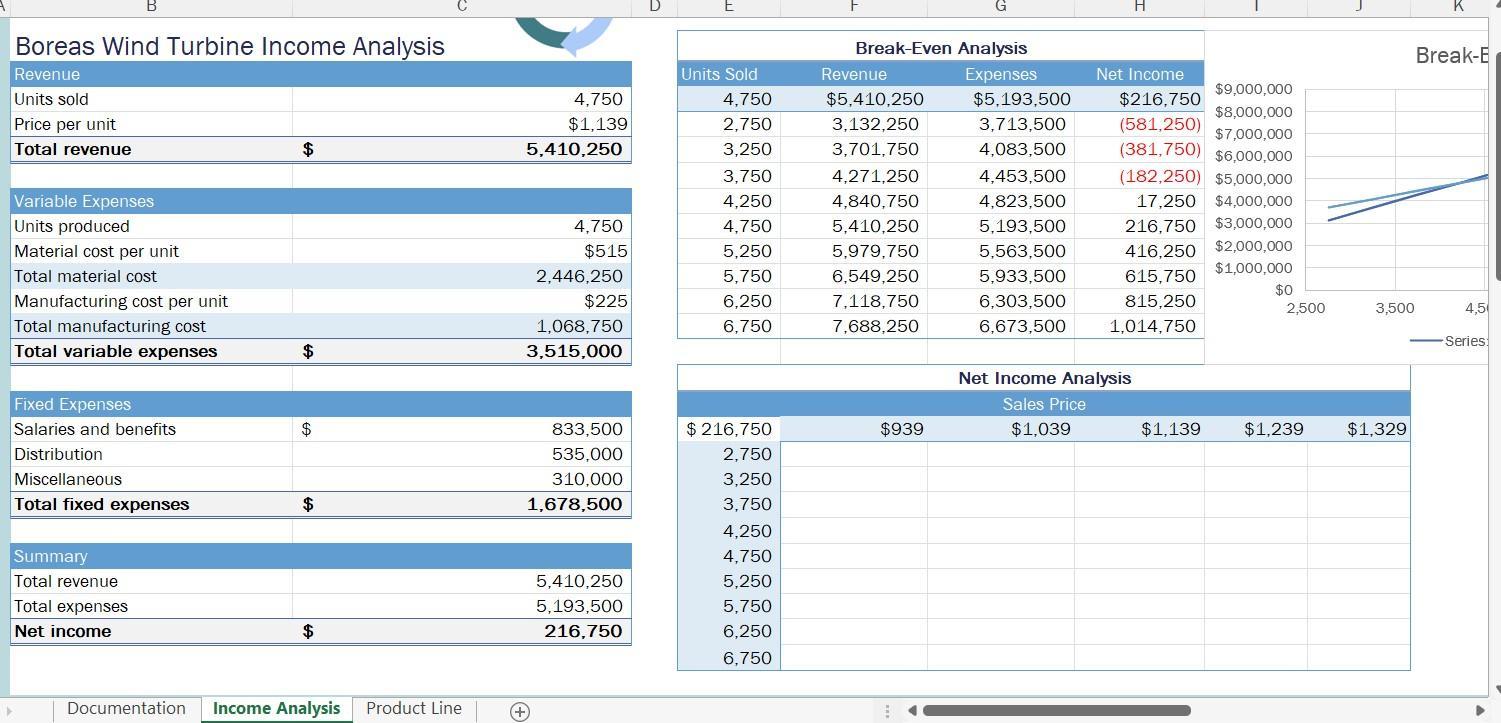
B Boreas Wind Turbine Income Analysis Revenue Units sold Price per unit Total revenue Variable Expenses Units produced D Break-Even Analysis K Break-E Units Sold Revenue Expenses Net Income $9,000,000 4,750 4,750 $5,410,250 $5,193,500 $216,750 $8,000,000 $1,139 2,750 3,132,250 3,713,500 (581,250) $7,000,000 $ 5,410,250 3,250 3,701,750 4,083,500 3,750 4,271,250 4,453,500 (381,750) $6,000,000 (182,250) $5,000,000 4,250 4,840,750 4,823,500 4,750 4,750 5,410,250 5,193,500 $515 5,250 5,979,750 5,563,500 2,446,250 5,750 6,549,250 5,933,500 17,250 $4,000,000 216,750 $3,000,000 416,250 $2,000,000 $1,000,000 615,750 $225 6,250 7,118,750 6,303,500 815,250 $0 2,500 3,500 4,5 1,068,750 6,750 7,688,250 6,673,500 1,014,750 Series: $ 3,515,000 Material cost per unit Total material cost Manufacturing cost per unit Total manufacturing cost Total variable expenses Fixed Expenses Salaries and benefits $ 833,500 $216,750 $939 Distribution 535,000 2,750 Miscellaneous 310,000 3,250 Total fixed expenses $ 1,678,500 3,750 4,250 Summary 4,750 Total revenue 5,410,250 5,250 Total expenses 5,193,500 5,750 Net income $ 216,750 6,250 6,750 Documentation Income Analysis Product Line Net Income Analysis Sales Price $1,039 $1,139 $1,239 $1,329
Step by Step Solution
There are 3 Steps involved in it
Step: 1
Here are the stepbystep instructions to complete Madhus Excel project using the details provided Step 1 Update the Chart 1 Select the Chart Locate the chart you want to update Click on it to select it ...
Get Instant Access to Expert-Tailored Solutions
See step-by-step solutions with expert insights and AI powered tools for academic success
Step: 2

Step: 3
Ace Your Homework with AI
Get the answers you need in no time with our AI-driven, step-by-step assistance
Get Started
The Impact Of Globalization On International Finance And Accounting
Authors: David Procházka
1st Edition
3319687611, 9783319687612