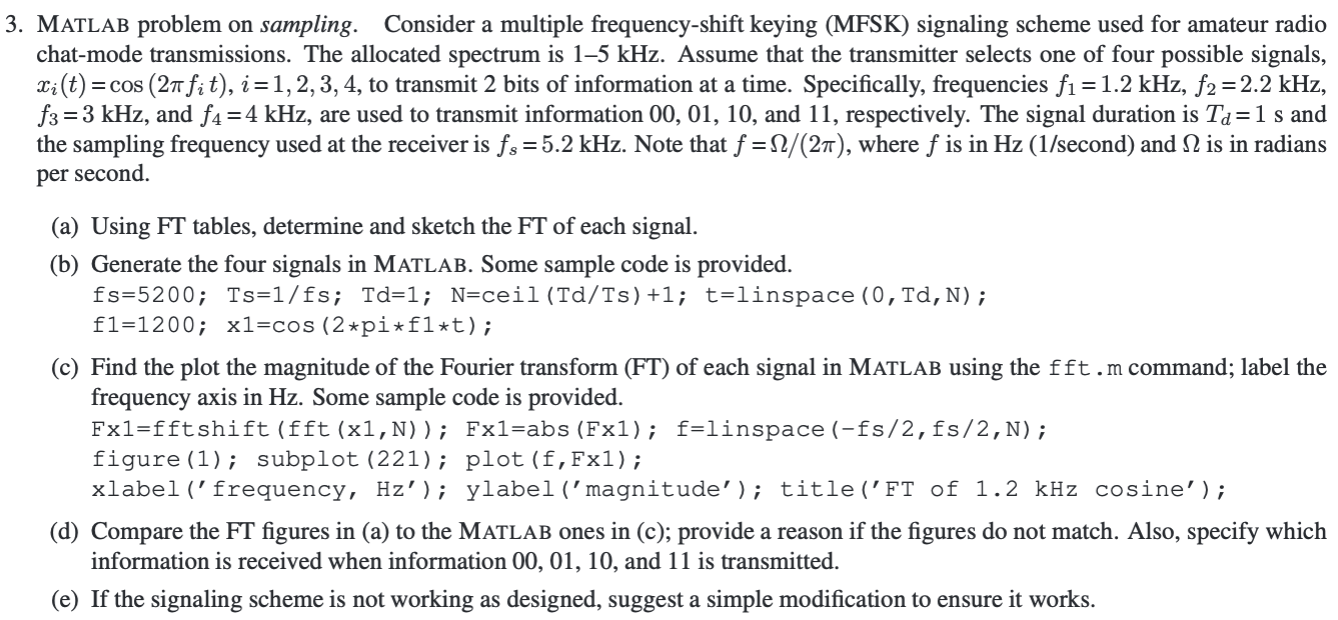
3. MATLAB problem on sampling. Consider a multiple frequency-shift keying (MFSK) signaling scheme used for amateur radio chat-mode transmissions. The allocated spectrum is 15 kHz. Assume that the transmitter selects one of four possible signals, Xi(t)=cos (27 fit), i=1,2,3, 4, to transmit 2 bits of information at a time. Specifically, frequencies f = 1.2 kHz, f2 = 2.2 kHz, f3=3 kHz, and f4 =4 kHz, are used to transmit information 00, 01, 10, and 11, respectively. The signal duration is Ta=1 s and the sampling frequency used at the receiver is fs = 5.2 kHz. Note that f = 1/(27), where f is in Hz (1/second) and N is in radians per second (a) Using FT tables, determine and sketch the FT of each signal. (b) Generate the four signals in MATLAB. Some sample code is provided. fs=5200; Ts=1/fs; Td=1; N=ceil(Td/Ts) +1; t=linspace (0, TD, N); f1=1200; x1=cos (2*pi*fl*t); (c) Find the plot the magnitude of the Fourier transform (FT) of each signal in MATLAB using the fft.m command; label the frequency axis in Hz. Some sample code is provided. Fx1=fft shift (fft (x1,N)); Fx1=abs (Fx1); f=linspace (-fs/2, fs/2,N); figure (1); subplot (221); plot (f, Fx1); xlabel('frequency, Hz'); ylabel('magnitude'); title('FT of 1.2 kHz cosine'); (d) Compare the FT figures in (a) to the MATLAB ones in (c); provide a reason if the figures do not match. Also, specify which information is received when information 00, 01, 10, and 11 is transmitted. (e) If the signaling scheme is not working as designed, suggest a simple modification to ensure it works 3. MATLAB problem on sampling. Consider a multiple frequency-shift keying (MFSK) signaling scheme used for amateur radio chat-mode transmissions. The allocated spectrum is 15 kHz. Assume that the transmitter selects one of four possible signals, Xi(t)=cos (27 fit), i=1,2,3, 4, to transmit 2 bits of information at a time. Specifically, frequencies f = 1.2 kHz, f2 = 2.2 kHz, f3=3 kHz, and f4 =4 kHz, are used to transmit information 00, 01, 10, and 11, respectively. The signal duration is Ta=1 s and the sampling frequency used at the receiver is fs = 5.2 kHz. Note that f = 1/(27), where f is in Hz (1/second) and N is in radians per second (a) Using FT tables, determine and sketch the FT of each signal. (b) Generate the four signals in MATLAB. Some sample code is provided. fs=5200; Ts=1/fs; Td=1; N=ceil(Td/Ts) +1; t=linspace (0, TD, N); f1=1200; x1=cos (2*pi*fl*t); (c) Find the plot the magnitude of the Fourier transform (FT) of each signal in MATLAB using the fft.m command; label the frequency axis in Hz. Some sample code is provided. Fx1=fft shift (fft (x1,N)); Fx1=abs (Fx1); f=linspace (-fs/2, fs/2,N); figure (1); subplot (221); plot (f, Fx1); xlabel('frequency, Hz'); ylabel('magnitude'); title('FT of 1.2 kHz cosine'); (d) Compare the FT figures in (a) to the MATLAB ones in (c); provide a reason if the figures do not match. Also, specify which information is received when information 00, 01, 10, and 11 is transmitted. (e) If the signaling scheme is not working as designed, suggest a simple modification to ensure it works