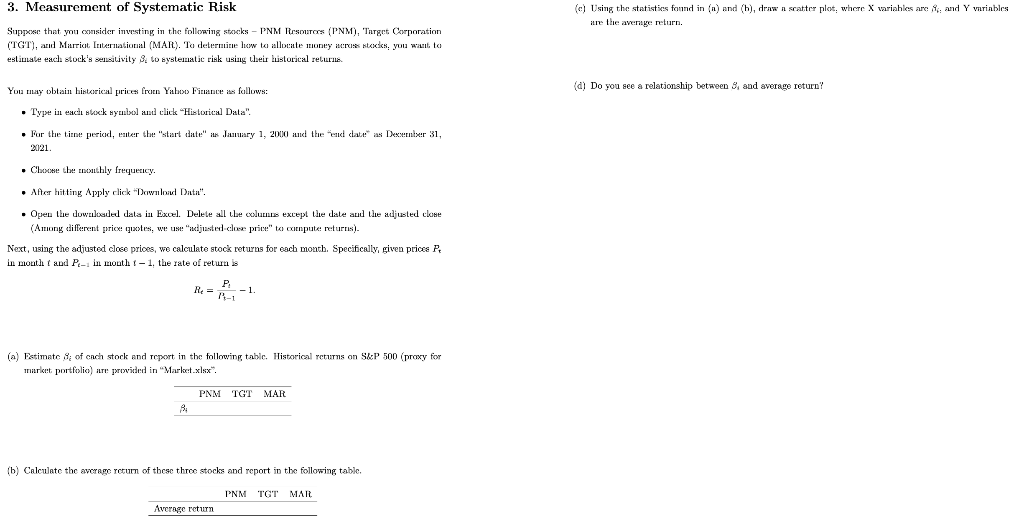
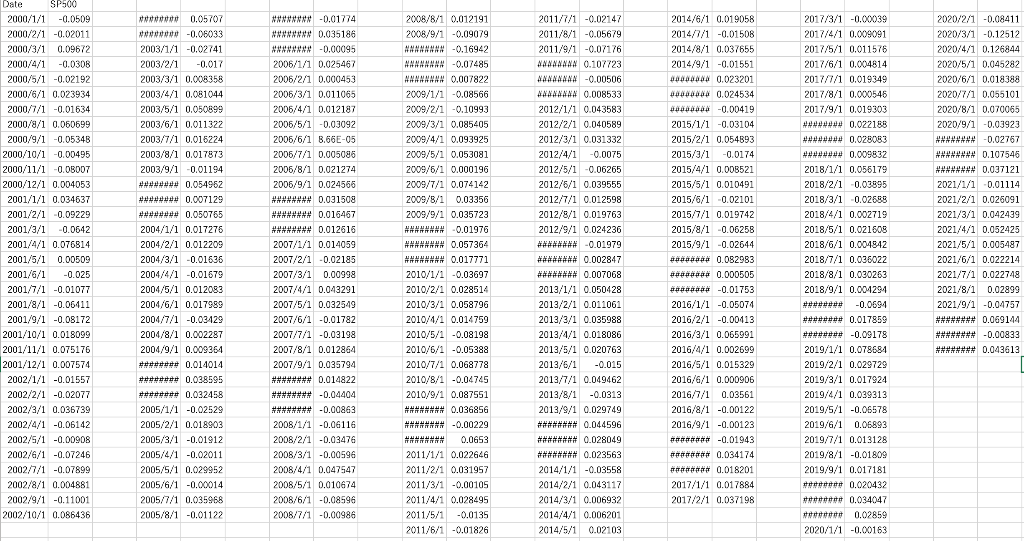
3. Measurement of Systematic Risk (c) Vsing the statisties fonnd in (a) and (h), drsw a scatter plot, where X variahles are ig: and Y vurinbles Suppose that you consider investing in the following stoeks - PNM Frsparcos (PNM), 'Turget Corporation are the avernge return. (TGT), and Murriat International (MAI). To deternute how to allotate money anross stodes: you mant ta estimsale each stock's sensilivity t bo systenatic risk using their histurical reburnio. You obtain historical prices from Yaboo Fitance is follows: (d) Do you see a relationship between Bi and average return? - Type in eacht suock aymbol and click "Historical Data". - For the tizne periad, enter the "start date" as Jamaary 1, 2010 and the "end date" as Dexsemtser 31, 2121. - Choose the rooxthly frequericy. - After hitting Apply click "Dowuload Data". - Oper the dowalocaded data ia Eoxcel. Delele all the colunnas except the date and the adjusted close (Among different gricxe tyoxtes, we use "wdjusted-close prise" to cornpute returns)- Next, using the adjusted cloee prioes, we calculate stock returns for each month. Specifically, given prices Pt in month t and Pt1 in month t1, the rate of return is Rt=Pt1Pl1 (a) Fatimate 8c of cach stock and report in the following table. Historical returns on SkP 500 (proxy for manrkat portfolio) aure groviaded in "Marlact_xlsx". (b) Calculate the axcrage recurn of these throe stocks and report in the folloning table. 3. Measurement of Systematic Risk (c) Vsing the statisties fonnd in (a) and (h), drsw a scatter plot, where X variahles are ig: and Y vurinbles Suppose that you consider investing in the following stoeks - PNM Frsparcos (PNM), 'Turget Corporation are the avernge return. (TGT), and Murriat International (MAI). To deternute how to allotate money anross stodes: you mant ta estimsale each stock's sensilivity t bo systenatic risk using their histurical reburnio. You obtain historical prices from Yaboo Fitance is follows: (d) Do you see a relationship between Bi and average return? - Type in eacht suock aymbol and click "Historical Data". - For the tizne periad, enter the "start date" as Jamaary 1, 2010 and the "end date" as Dexsemtser 31, 2121. - Choose the rooxthly frequericy. - After hitting Apply click "Dowuload Data". - Oper the dowalocaded data ia Eoxcel. Delele all the colunnas except the date and the adjusted close (Among different gricxe tyoxtes, we use "wdjusted-close prise" to cornpute returns)- Next, using the adjusted cloee prioes, we calculate stock returns for each month. Specifically, given prices Pt in month t and Pt1 in month t1, the rate of return is Rt=Pt1Pl1 (a) Fatimate 8c of cach stock and report in the following table. Historical returns on SkP 500 (proxy for manrkat portfolio) aure groviaded in "Marlact_xlsx". (b) Calculate the axcrage recurn of these throe stocks and report in the folloning table