

Question
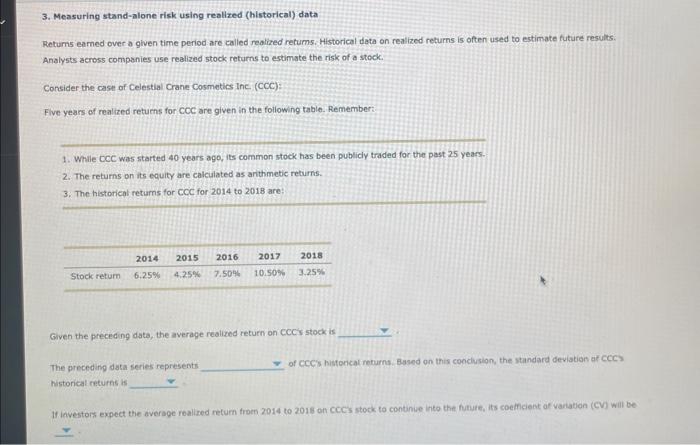
3. Measuring stand-alone risk using realized (historical) data Returns earned over a given time period are called realized returns. Historical data on realized returns is
3. Measuring stand-alone risk using realized (historical) data
Returns earned over a given time period are called realized returns. Historical data on realized returns is often used to estimate future results.
Analysts across companies use realized stock returns to estimate the risk of a stock.
Consider the case of Celestial Crane Cosmetics Inc. (CCC):
Five years of realized returns for CCC are given in the following table. Remember:
- While CCC was started 40 years ago, its common stock has been publicly traded for the past 25 years.
- The returns on its equity are calculated as arithmetic returns.
- The historical returns for CCC for 2014 to 2018 are:
Stock return
2014
6.25%
2015
4.25%
2016
7.50%
2017
2018
10.50%
3.25%
Given the preceding data, the average realized return on CCC's stock is
The preceding data series represents historical returns is
of CCC's historical returns. Based on this conclusion, the standard deviation of CCC's
If investors expect the average realized return from 2014 to 2018 on CCC's stock to continue into the future, its coefficient of variation (CV) will be
Step by Step Solution
There are 3 Steps involved in it
Step: 1

Get Instant Access to Expert-Tailored Solutions
See step-by-step solutions with expert insights and AI powered tools for academic success
Step: 2

Step: 3
Ace Your Homework with AI
Get the answers you need in no time with our AI-driven, step-by-step assistance
Get Started
How Much Can I Spend In Retirement A Guide To Investment Based Retirement Income Strategies
Authors: Wade D Pfau
1st Edition
1945640022, 978-1945640025