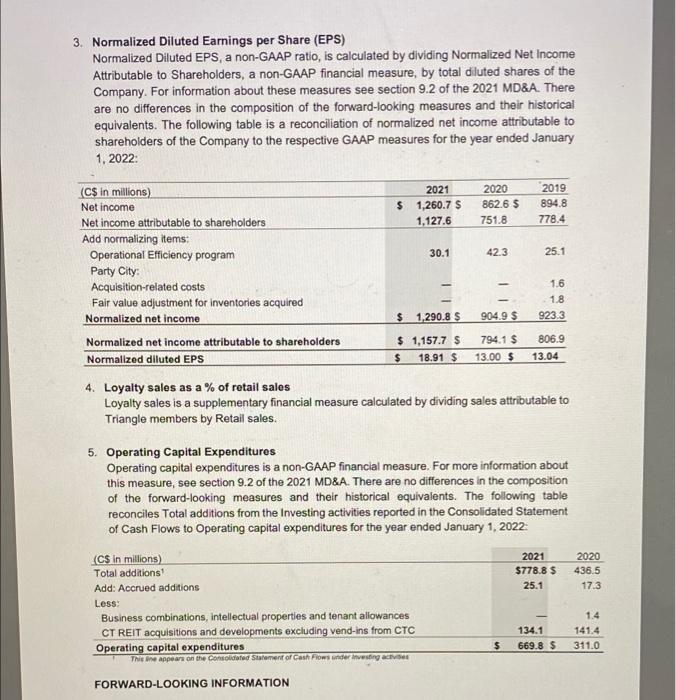
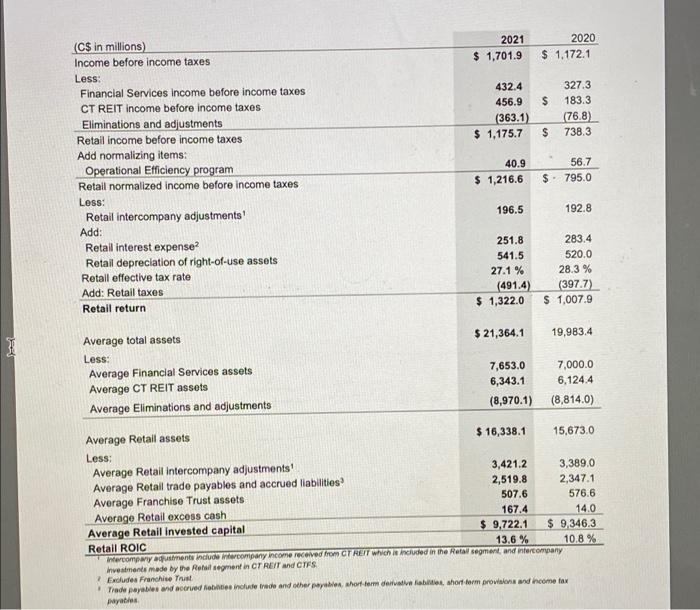
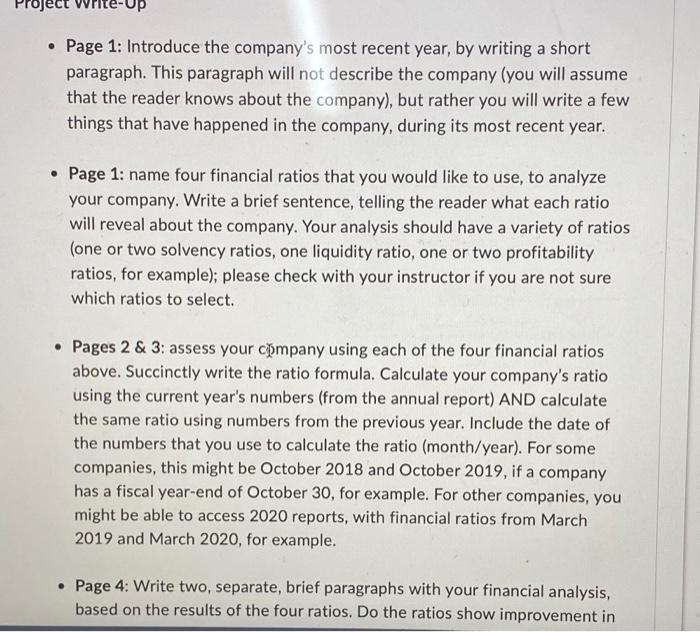
3. Normalized Diluted Earnings per Share (EPS) Normalized Diluted EPS, a non-GAAP ratio, is calculated by dividing Normalized Net Income Attributable to Shareholders, a non-GAAP financial measure, by total diluted shares of the Company. For information about these measures see section 9.2 of the 2021 MD&A. There are no differences in the composition of the forward-looking measures and their historical equivalents. The following table is a reconciliation of normalized net income attributable to shareholders of the Company to the respective GAAP measures for the year ended January 1.2022 - (C$ in millions) 2021 2020 2019 Net income $ 1,260.7 $ 862.6 $ 894.8 Net income attributable to shareholders 1,127.6 751.8 778.4 Add normalizing items: Operational Efficiency program 30.1 42.3 25.1 Party City: Acquisition-related costs 1.6 Fair value adjustment for inventories acquired 1.8 Normalized net income $ 1,290.8 $ 904.9 $ 9233 Normalized net income attributable to shareholders $ 1,157.7 $ 794.1 $ 806.9 Normalized diluted EPS $ 18.91 $ 13.00 $ 13.04 4. Loyalty sales as a % of retail sales Loyalty sales is a supplementary financial measure calculated by dividing sales attributable to Triangle members by Retail sales. 5. Operating Capital Expenditures Operating capital expenditures is a non-GAAP financial measure. For more information about this measure, see section 9.2 of the 2021 MD&A. There are no differences in the composition of the forward-looking measures and their historical equivalents. The following table reconciles Total additions from the Investing activities reported in the Consolidated Statement of Cash Flows to Operating capital expenditures for the year ended January 1, 2022 2021 $778.8 $ 25.1 2020 436.5 17.3 (C$ in millions) Total additions Add: Accrued additions Less Business combinations, intellectual properties and tenant allowances CT REIT acquisitions and developments excluding vend-ins from CTC Operating capital expenditures This tine appears on the consolidated Statement of Cash Flows under investing av 134.1 669.8 $ 1.4 141.4 311.0 $ FORWARD-LOOKING INFORMATION 2021 $ 1,701.9 2020 $ 1,172.1 $ 432.4 456.9 (363.1) $ 1,175.7 327.3 183.3 (76.8) 738.3 $ (C$ in millions) Income before income taxes Less: Financial Services Income before income taxes CT REIT income before income taxes Eliminations and adjustments Retail income before income taxes Add normalizing items: Operational Efficiency program Retail normalized income before income taxes Less: Retail intercompany adjustments! Add: Retail interest expense? Retail depreciation of right-of-use assets Retail effective tax rate Add: Retail taxes Retail return 40.9 $ 1,216.6 56.7 $ 795.0 196.5 192.8 251.8 541.5 27.1 % (491.4) $ 1,322.0 283.4 520.0 28.3 % (397.7) $ 1,007.9 $ 21,364.1 19,983.4 Average total assets Less: Average Financial Services assets Average CT REIT assets Average Eliminations and adjustments 7,653.0 6,343.1 (8,970.1) 7,000.0 6,124.4 (8,814.0) Average Retail assets $ 16,338.1 15,673.0 Less: Average Retail intercompany adjustments! 3,421.2 3,389.0 Average Retail trade payables and accrued liabilities 2,519.8 2,3471 Average Franchise Trust assets 507.6 576.6 Average Retail excess cash 167.4 14.0 Average Retail invested capital $ 9,722.1 $ 9,346,3 Retail ROIC 13.6 % 10.8% Intercompartments include company income received from CT HET which included in the Hatal segment, and intercompany Investments made by the Retail segment in CT REIT and CTES Excludes Franchise Trust Trade payables and accrued abilities include trade and other short-term derivatives, ahorfform prowakose and income tax payables Project wr Page 1: Introduce the company's most recent year, by writing a short paragraph. This paragraph will not describe the company (you will assume that the reader knows about the company), but rather you will write a few things that have happened in the company, during its most recent year. Page 1: name four financial ratios that you would like to use, to analyze your company. Write a brief sentence, telling the reader what each ratio will reveal about the company. Your analysis should have a variety of ratios (one or two solvency ratios, one liquidity ratio, one or two profitability ratios, for example); please check with your instructor if you are not sure which ratios to select. Pages 2 & 3: assess your company using each of the four financial ratios above. Succinctly write the ratio formula. Calculate your company's ratio using the current year's numbers (from the annual report) AND calculate the same ratio using numbers from the previous year. Include the date of the numbers that you use to calculate the ratio (month/year). For some companies, this might be October 2018 and October 2019, if a company has a fiscal year-end of October 30, for example. For other companies, you might be able to access 2020 reports, with financial ratios from March 2019 and March 2020, for example. Page 4: Write two, separate, brief paragraphs with your financial analysis, based on the results of the four ratios. Do the ratios show improvement in SUUV. Duccincty write the ratio formula. Calculate your company's ratio using the current year's numbers from the annual report) AND calculate the same ratio using numbers from the previous year. Include the date of the numbers that you use to calculate the ratio (month/year). For some companies, this might be October 2018 and October 2019, la company has a fiscal year-end of October 30, for example. For other companies, you might be able to access 2020 reports, with financial ratios from March 2019 and March 2020, for example. Page 4: Write two separate, brief paragraphs with your financial analysis, based on the results of the four ratios. Do the ratios show improvement in the financial health of the company? Explain (briefly) why or why not. The report will be no more than 5 pages (preferably 4 pages) single spaced. 3. Normalized Diluted Earnings per Share (EPS) Normalized Diluted EPS, a non-GAAP ratio, is calculated by dividing Normalized Net Income Attributable to Shareholders, a non-GAAP financial measure, by total diluted shares of the Company. For information about these measures see section 9.2 of the 2021 MD&A. There are no differences in the composition of the forward-looking measures and their historical equivalents. The following table is a reconciliation of normalized net income attributable to shareholders of the Company to the respective GAAP measures for the year ended January 1.2022 - (C$ in millions) 2021 2020 2019 Net income $ 1,260.7 $ 862.6 $ 894.8 Net income attributable to shareholders 1,127.6 751.8 778.4 Add normalizing items: Operational Efficiency program 30.1 42.3 25.1 Party City: Acquisition-related costs 1.6 Fair value adjustment for inventories acquired 1.8 Normalized net income $ 1,290.8 $ 904.9 $ 9233 Normalized net income attributable to shareholders $ 1,157.7 $ 794.1 $ 806.9 Normalized diluted EPS $ 18.91 $ 13.00 $ 13.04 4. Loyalty sales as a % of retail sales Loyalty sales is a supplementary financial measure calculated by dividing sales attributable to Triangle members by Retail sales. 5. Operating Capital Expenditures Operating capital expenditures is a non-GAAP financial measure. For more information about this measure, see section 9.2 of the 2021 MD&A. There are no differences in the composition of the forward-looking measures and their historical equivalents. The following table reconciles Total additions from the Investing activities reported in the Consolidated Statement of Cash Flows to Operating capital expenditures for the year ended January 1, 2022 2021 $778.8 $ 25.1 2020 436.5 17.3 (C$ in millions) Total additions Add: Accrued additions Less Business combinations, intellectual properties and tenant allowances CT REIT acquisitions and developments excluding vend-ins from CTC Operating capital expenditures This tine appears on the consolidated Statement of Cash Flows under investing av 134.1 669.8 $ 1.4 141.4 311.0 $ FORWARD-LOOKING INFORMATION 2021 $ 1,701.9 2020 $ 1,172.1 $ 432.4 456.9 (363.1) $ 1,175.7 327.3 183.3 (76.8) 738.3 $ (C$ in millions) Income before income taxes Less: Financial Services Income before income taxes CT REIT income before income taxes Eliminations and adjustments Retail income before income taxes Add normalizing items: Operational Efficiency program Retail normalized income before income taxes Less: Retail intercompany adjustments! Add: Retail interest expense? Retail depreciation of right-of-use assets Retail effective tax rate Add: Retail taxes Retail return 40.9 $ 1,216.6 56.7 $ 795.0 196.5 192.8 251.8 541.5 27.1 % (491.4) $ 1,322.0 283.4 520.0 28.3 % (397.7) $ 1,007.9 $ 21,364.1 19,983.4 Average total assets Less: Average Financial Services assets Average CT REIT assets Average Eliminations and adjustments 7,653.0 6,343.1 (8,970.1) 7,000.0 6,124.4 (8,814.0) Average Retail assets $ 16,338.1 15,673.0 Less: Average Retail intercompany adjustments! 3,421.2 3,389.0 Average Retail trade payables and accrued liabilities 2,519.8 2,3471 Average Franchise Trust assets 507.6 576.6 Average Retail excess cash 167.4 14.0 Average Retail invested capital $ 9,722.1 $ 9,346,3 Retail ROIC 13.6 % 10.8% Intercompartments include company income received from CT HET which included in the Hatal segment, and intercompany Investments made by the Retail segment in CT REIT and CTES Excludes Franchise Trust Trade payables and accrued abilities include trade and other short-term derivatives, ahorfform prowakose and income tax payables Project wr Page 1: Introduce the company's most recent year, by writing a short paragraph. This paragraph will not describe the company (you will assume that the reader knows about the company), but rather you will write a few things that have happened in the company, during its most recent year. Page 1: name four financial ratios that you would like to use, to analyze your company. Write a brief sentence, telling the reader what each ratio will reveal about the company. Your analysis should have a variety of ratios (one or two solvency ratios, one liquidity ratio, one or two profitability ratios, for example); please check with your instructor if you are not sure which ratios to select. Pages 2 & 3: assess your company using each of the four financial ratios above. Succinctly write the ratio formula. Calculate your company's ratio using the current year's numbers (from the annual report) AND calculate the same ratio using numbers from the previous year. Include the date of the numbers that you use to calculate the ratio (month/year). For some companies, this might be October 2018 and October 2019, if a company has a fiscal year-end of October 30, for example. For other companies, you might be able to access 2020 reports, with financial ratios from March 2019 and March 2020, for example. Page 4: Write two, separate, brief paragraphs with your financial analysis, based on the results of the four ratios. Do the ratios show improvement in SUUV. Duccincty write the ratio formula. Calculate your company's ratio using the current year's numbers from the annual report) AND calculate the same ratio using numbers from the previous year. Include the date of the numbers that you use to calculate the ratio (month/year). For some companies, this might be October 2018 and October 2019, la company has a fiscal year-end of October 30, for example. For other companies, you might be able to access 2020 reports, with financial ratios from March 2019 and March 2020, for example. Page 4: Write two separate, brief paragraphs with your financial analysis, based on the results of the four ratios. Do the ratios show improvement in the financial health of the company? Explain (briefly) why or why not. The report will be no more than 5 pages (preferably 4 pages) single spaced


