

Answered step by step
Verified Expert Solution
Question
1 Approved Answer
3 of 5 (3 complete) Problem 18-1B (similar to) Selected financial information for Enzyme Limited for a six-year period follows: (Amounts in thousands) 2020 2019
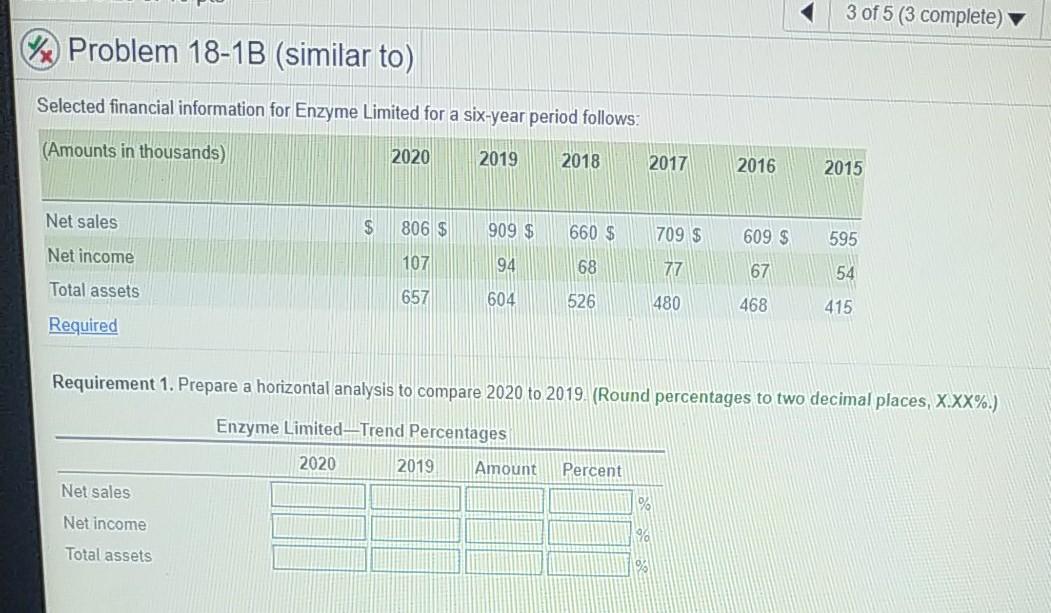
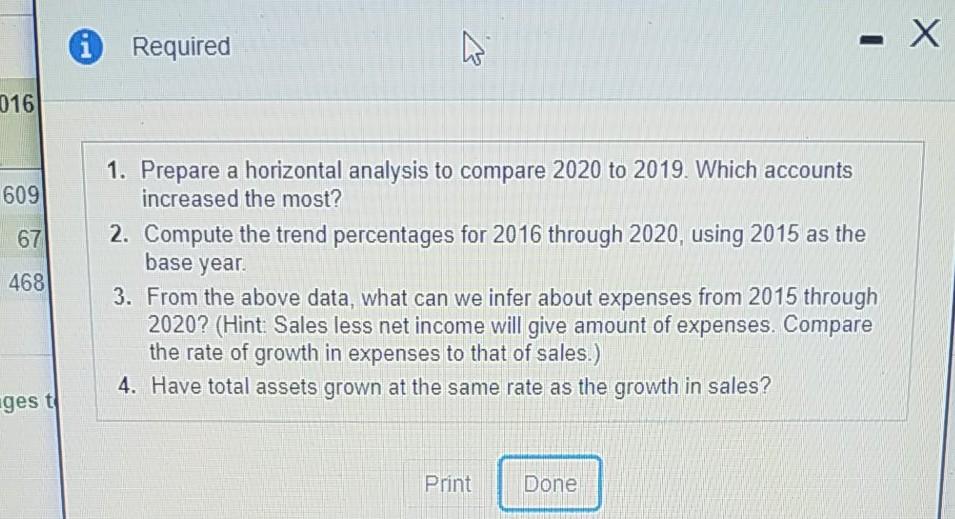
3 of 5 (3 complete) Problem 18-1B (similar to) Selected financial information for Enzyme Limited for a six-year period follows: (Amounts in thousands) 2020 2019 2018 2017 2016 2015 Net sales $ 806 $ 909 $ 660 $ 709 $ 609 $ 595 Net income 107 94 68 77 67 54 Total assets 657 604 526 480 468 415 Required Requirement 1. Prepare a horizontal analysis to compare 2020 to 2019 (Round percentages to two decimal places, X.XX%.) Enzyme Limited-Trend Percentages 2020 2019 Amount Percent Net sales % Net income Total assets i Required X 016 609 1. Prepare a horizontal analysis to compare 2020 to 2019. Which accounts increased the most? 2. Compute the trend percentages for 2016 through 2020, using 2015 as the 67 base year. 468 3. From the above data, what can we infer about expenses from 2015 through 2020? (Hint Sales less net income will give amount of expenses. Compare the rate of growth in expenses to that of sales.) 4. Have total assets grown at the same rate as the growth in sales? ges til Print Done 3 of 5 (3 complete) Problem 18-1B (similar to) Selected financial information for Enzyme Limited for a six-year period follows: (Amounts in thousands) 2020 2019 2018 2017 2016 2015 Net sales $ 806 $ 909 $ 660 $ 709 $ 609 $ 595 Net income 107 94 68 77 67 54 Total assets 657 604 526 480 468 415 Required Requirement 1. Prepare a horizontal analysis to compare 2020 to 2019 (Round percentages to two decimal places, X.XX%.) Enzyme Limited-Trend Percentages 2020 2019 Amount Percent Net sales % Net income Total assets i Required X 016 609 1. Prepare a horizontal analysis to compare 2020 to 2019. Which accounts increased the most? 2. Compute the trend percentages for 2016 through 2020, using 2015 as the 67 base year. 468 3. From the above data, what can we infer about expenses from 2015 through 2020? (Hint Sales less net income will give amount of expenses. Compare the rate of growth in expenses to that of sales.) 4. Have total assets grown at the same rate as the growth in sales? ges til Print Done
Step by Step Solution
There are 3 Steps involved in it
Step: 1

Get Instant Access to Expert-Tailored Solutions
See step-by-step solutions with expert insights and AI powered tools for academic success
Step: 2

Step: 3
Ace Your Homework with AI
Get the answers you need in no time with our AI-driven, step-by-step assistance
Get Started
Tax Audit Guidelines For The State Of California Employment Development Department
Authors: State Of California, Employment Development Department
1st Edition
B0C1J7KT6R, 979-8390634066