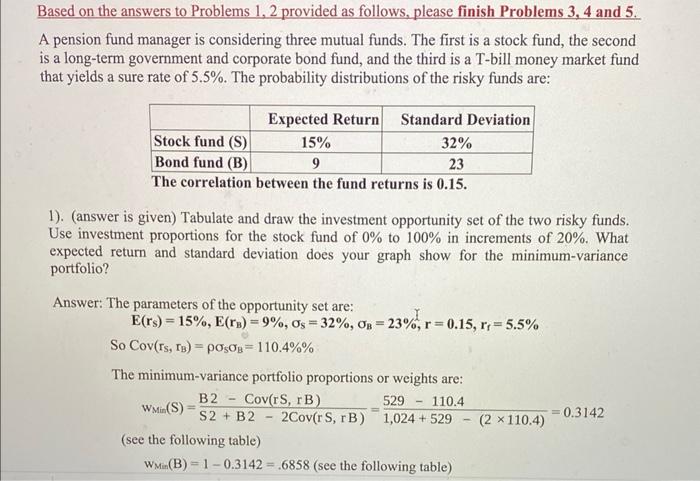
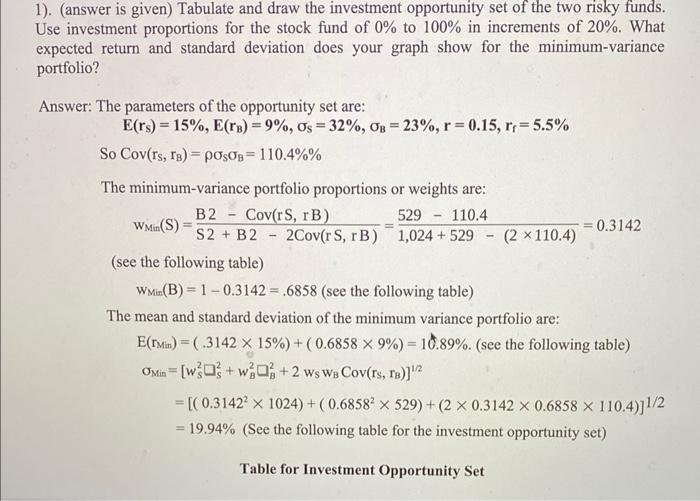
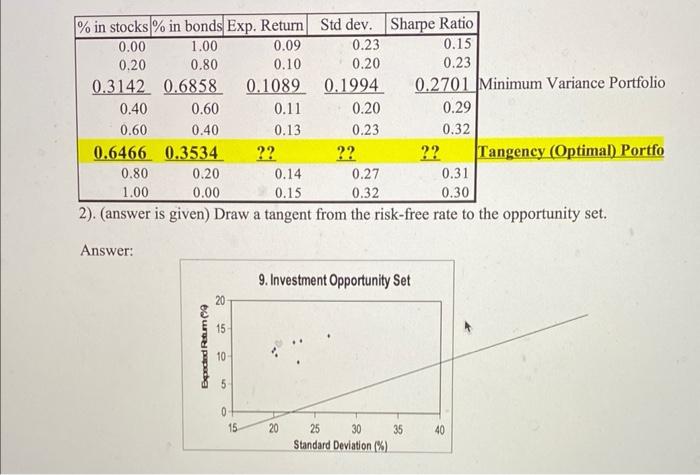
3). Please finish the following three sub-problems. (1) What is the expected return and standard deviation of the optimal (tangency) risky portfolio? (Hint: The weights of the two risky assets within the optimal risky portfolio is simply given in the table above, Ws= 0.6466; WB-0.3534) (2) Then what is the Sharpe ratio of the optimal risky portfolio? (3) Is the Sharpe ratio of the optimal risky portfolio equal to the Sharpe ratio of the best complete portfolio when you add the risky-free asset? --- just answer Yes or No. 4). Assume that one client's complete portfolio must yield an expected return of 12%. What will be the standard deviation of his complete portfolio that the manager will tell him about? (Hint: This is a question for complete portfolio. You should find the weights of the risky portfolio and risk-free asset within this particular complete portfolio first by using the conditions given that the expected return of complete portfolio is 12%, the risk-free interest rate is 5.5%, and the expected return of risky portfolio obtained in Question 3(1) above. Then you can get the standard deviation of the complete portfolio based on the standard deviation of the sky portfolio. See Chapter 5 for formulas) 5). Assume that one client would like to use only the two risky assets (stock and bond stated above) in his portfolio and require an expected return of 12%, what will be the standard deviation of his risky portfolio that the manager will tell him about? (Hint: You should find weights of the two risky assets within the risky portfolio by using the conditions given that the expected return of this risky portfolio is 12%, and E(rs) 15%, E(ra)= 9%; no risk-free assets are involved here, so it is NOT a question about complete portfolio anymore but a question about risky portfolio. See Chapter 6 for formulas) = Based on the answers to Problems 1, 2 provided as follows, please finish Problems 3, 4 and 5. A pension fund manager is considering three mutual funds. The first is a stock fund, the second is a long-term government and corporate bond fund, and the third is a T-bill money market fund that yields a sure rate of 5.5%. The probability distributions of the risky funds are: Expected Return Standard Deviation Stock fund (S) 32% 15% 9 Bond fund (B) 23 The correlation between the fund returns is 0.15. 1). (answer is given) Tabulate and draw the investment opportunity set of the two risky funds. Use investment proportions for the stock fund of 0% to 100% in increments of 20%. What expected return and standard deviation does your graph show for the minimum-variance portfolio? Answer: The parameters of the opportunity set are: E(rs) = 15%, E(rs) = 9%, Os=32%, OB = 2 So Cov(rs, TB) posOB = 110.4%% The minimum-variance portfolio proportions or weights are: 110.4 WMin(S) = B2 S2 + B2 Cov(rS, rB) = - 23%, r=0.15, r = 5.5% - 2Cov(r S, rB) 529 1,024 +529 (see the following table) WMin(B) 1-0.3142= .6858 (see the following table) - (2110.4) = 0.3142 1). (answer is given) Tabulate and draw the investment opportunity set of the two risky funds. Use investment proportions for the stock fund of 0% to 100% in increments of 20%. What expected return and standard deviation does your graph show for the minimum-variance portfolio? Answer: The parameters of the opportunity set are: E(rs) = 15%, E(TB) = 9%, Os=32%, OB = 23%, r = 0.15, rr = 5.5% So Cov(rs, TB) = POSOB= 110.4%% The minimum-variance portfolio proportions or weights are: 110.4 B2 S2 + B2 (see the following table) WMin(B) 1-0.3142.6858 (see the following table) The mean and standard deviation of the minimum variance portfolio are: E(TMin) =(.3142 x 15%) + (0.6858 x 9%) = 10.89%. (see the following table) WMin (S) = Cov(rS, rB) - 2Cov(r S, rB) 529 1,024 +529 OMin [w+w+2 ws WB Cov(rs, TB)]/2 = - (2 x 110.4) = 0.3142 = [(0.3142 x 1024) + (0.6858 x 529) + (2 x 0.3142 x 0.6858 x 110.4)]1/2 = 19.94% (See the following table for the investment opportunity set) Table for Investment Opportunity Set % in stocks % in bonds Exp. Return Std dev. Sharpe Ratio 0.00 1.00 0.09 0.23 0.15 0.20 0.80 0.10 0.20 0.23 0.3142 0.6858 0.1089 0.1994 0.2701 Minimum Variance Portfolio 0.40 0.60 0.6466 0.80 1.00 0.60 0.40 Answer: 0.3534 0.20 0.00 Expected Retum 8 15 10- 5 0- 0.11 0.13 0.14 0.27 0.15 0.32 2). (answer is given) Draw a tangent from the risk-free rate to the opportunity set. 15 ?? 0.20 0.23 22 20 9. Investment Opportunity Set 25 30 Standard Deviation (%) ?? 35 0.29 0.32 0.31 0.30 Tangency (Optimal) Portfo 40