

Answered step by step
Verified Expert Solution
Question
1 Approved Answer
3 points Sar Process time at a workstation is monitored using sample mean and range control charts. Six samples with 10 observations each have
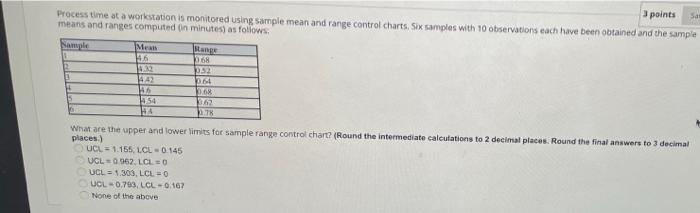
3 points Sar Process time at a workstation is monitored using sample mean and range control charts. Six samples with 10 observations each have been obtained and the sample means and ranges computed (in minutes) as follows: Sample 12 15 Mean Range 4.6 0.68 4.32 052 442 0.64 46 454 HA 62 0.78 What are the upper and lower limits for sample range control chart? (Round the intermediate calculations to 2 decimal places. Round the final answers to 3 decimal places.) UCL 1.155, LCL 0.145 UCL=0.962, LCL=0 UCL 1.303, LCL=0 UCL 0.793, LCL-0.167 None of the above t
Step by Step Solution
There are 3 Steps involved in it
Step: 1

Get Instant Access to Expert-Tailored Solutions
See step-by-step solutions with expert insights and AI powered tools for academic success
Step: 2

Step: 3
Ace Your Homework with AI
Get the answers you need in no time with our AI-driven, step-by-step assistance
Get Started
Financial Accounting in an Economic Context
Authors: Jamie Pratt
9th edition
9781118803035, 1118582551, 1118803035, 978-1118582558