

Answered step by step
Verified Expert Solution
Question
1 Approved Answer
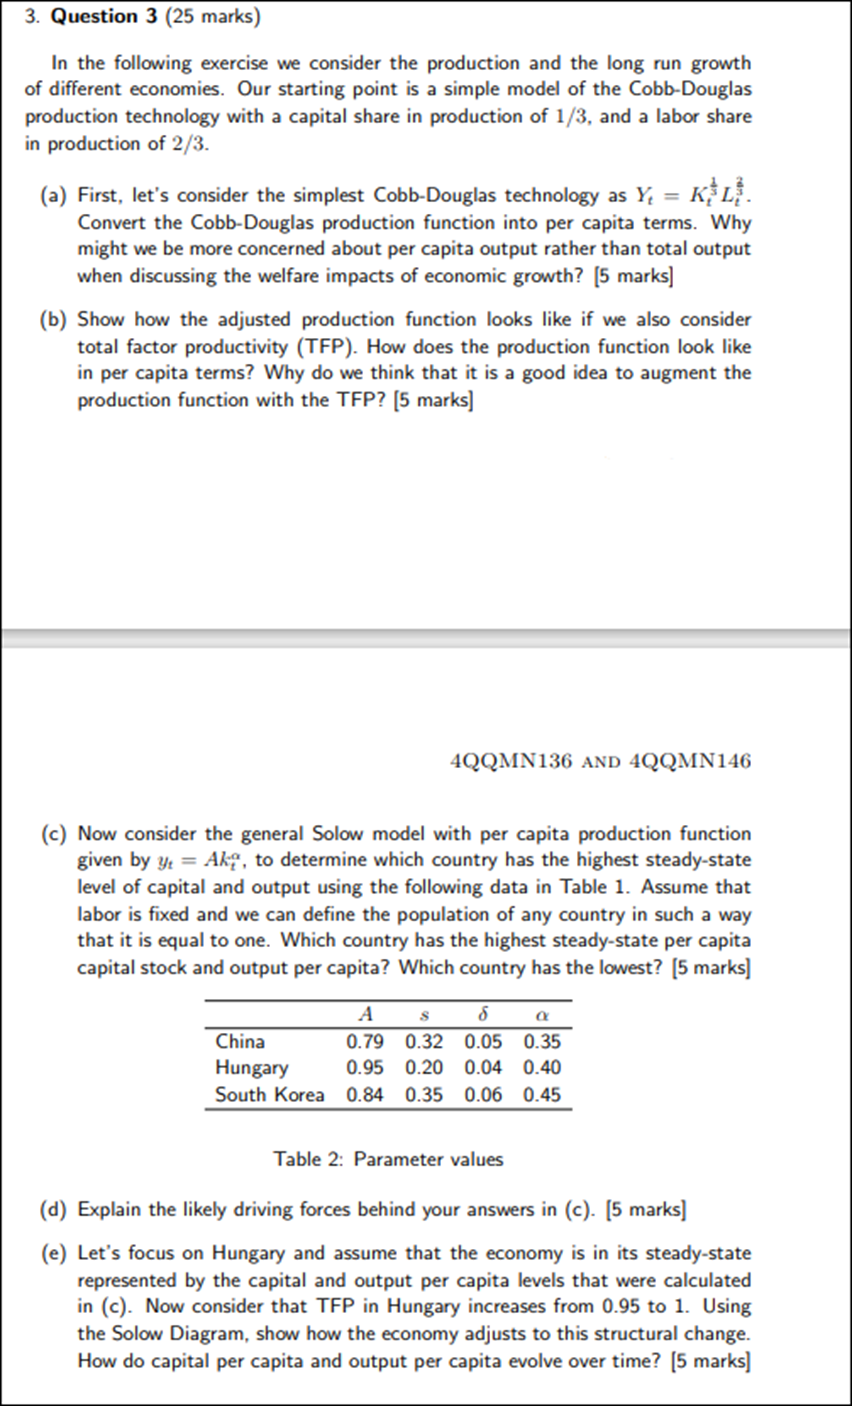
3. Question 3 (25 marks) In the following exercise we consider the production and the long run growth of different economies. Our starting point is
Step by Step Solution
There are 3 Steps involved in it
Step: 1

Get Instant Access to Expert-Tailored Solutions
See step-by-step solutions with expert insights and AI powered tools for academic success
Step: 2

Step: 3
Ace Your Homework with AI
Get the answers you need in no time with our AI-driven, step-by-step assistance
Get Started
Project Management A Systems Approach to Planning Scheduling and Controlling
Authors: Harold Kerzner
10th Edition
978-047027870, 978-0-470-5038, 470278706, 978-0470278703