Answered step by step
Verified Expert Solution
Question
1 Approved Answer
3. Rank the sites based on the data provided here through Equivalent Property Damage Only (EPDO) average crash frequency and Relative Severity Index (RSI)


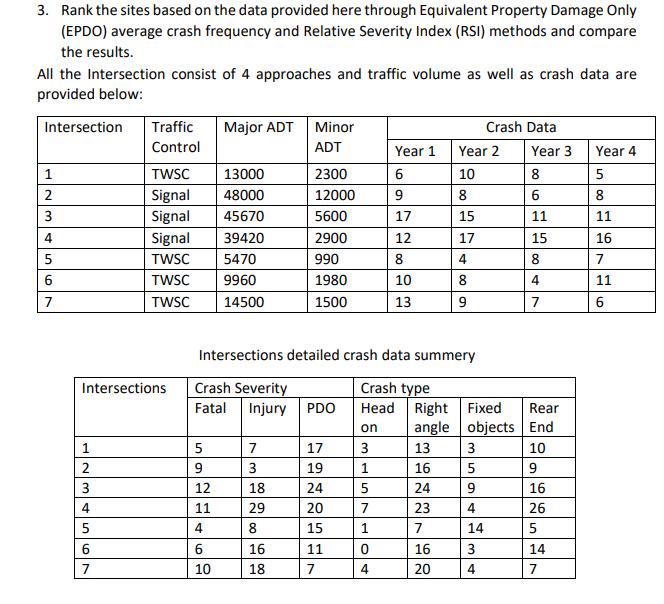
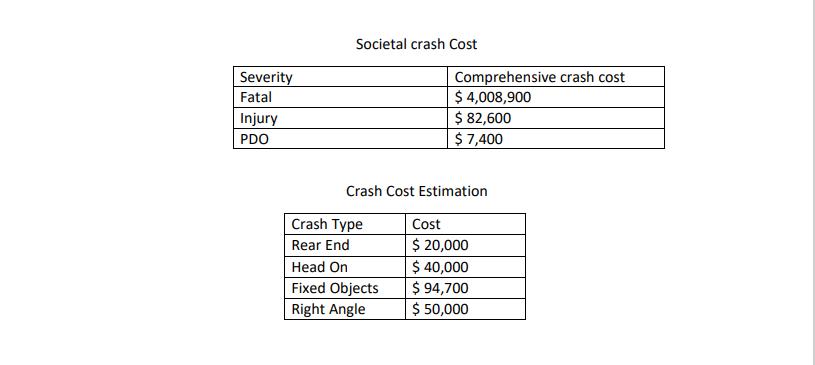
3. Rank the sites based on the data provided here through Equivalent Property Damage Only (EPDO) average crash frequency and Relative Severity Index (RSI) methods and compare the results. All the Intersection consist of 4 approaches and traffic volume as well as crash data are provided below: Intersection Traffic Major ADT Minor Crash Data Control ADT Year 1 Year 2 Year 3 Year 4 1 TWSC 13000 2300 6 10 8 5 2 Signal 48000 12000 9 8 6 8 3 Signal 45670 5600 17 15 11 11 4 Signal 39420 2900 12 17 15 16 5 TWSC 5470 990 8 4 8 7 6 TWSC 9960 1980 10 8 4 11 7 TWSC 14500 1500 13 9 7 10 6 Intersections detailed crash data summery Intersections Crash Severity Crash type Fatal Injury PDO Head Right Fixed Rear on angle objects End 1 5 7 17 3 13 3 10 2 9 19 1 16 5 9 3 12 18 24 24 9 16 4 11 29 20 7 23 4 26 5 4 15 1 7 14 5 6 6 16 11 0 16 3 14 7 10 18 7 4 20 4 7 Severity Fatal Injury PDO Societal crash Cost Comprehensive crash cost $ 4,008,900 $ 82,600 $7,400 Crash Cost Estimation Crash Type Cost Rear End $ 20,000 Head On $ 40,000 Fixed Objects $ 94,700 Right Angle $ 50,000
Step by Step Solution
There are 3 Steps involved in it
Step: 1

Get Instant Access to Expert-Tailored Solutions
See step-by-step solutions with expert insights and AI powered tools for academic success
Step: 2

Step: 3

Ace Your Homework with AI
Get the answers you need in no time with our AI-driven, step-by-step assistance
Get Started


