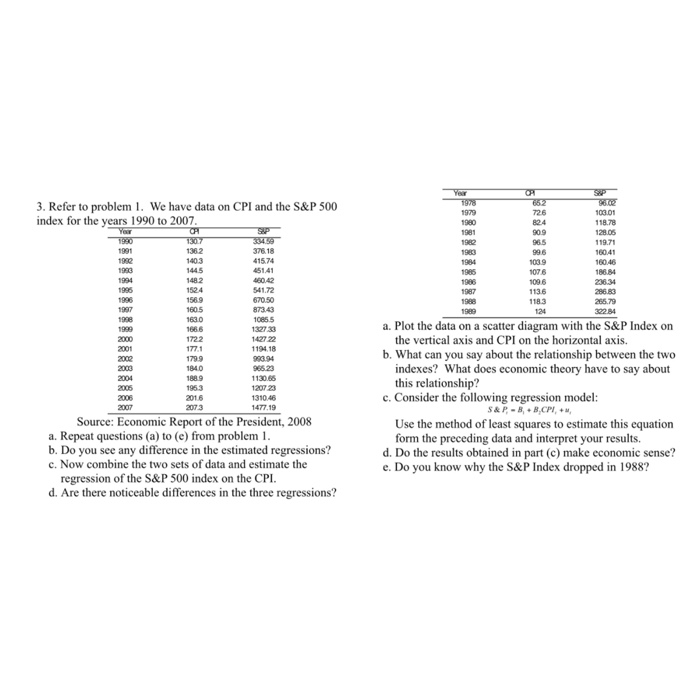
3. Refer to problem 1. We have data on CPI and the S&P 500 index for the years 1990 to 2007 18.78 119.71 160.46 376.18 415.74 107 6 1524 541.72 1183 265.79 322 84 a. Plot the data on a scatter diagram with the S&P Index on 1327 33 1427 22 1194.18 the vertical axis and CPI on the horizontal axis. b. What can you say about the relationship between the two indexes? What does economic theory have to say about this relationship? 13068 1207 23 1310.46 477.19 2016 2073 c. Consider the following regression model: Source: Economic Report of the President, 2008 Use the method of least squares to estimate this equation form the preceding data and interpret your results. a. Repeat questions (a) to (e) from problem 1 b. Do you see any difference in the estimated regressions? d. Do the results obtained in part (c) make economic sense? e. Do you know why the S&P Index dropped in 1988? c. Now combine the two sets of data and estimate the regression of the S&P 500 index on the CPI d. Are there noticeable differences in the three regressions? 3. Refer to problem 1. We have data on CPI and the S&P 500 index for the years 1990 to 2007 18.78 119.71 160.46 376.18 415.74 107 6 1524 541.72 1183 265.79 322 84 a. Plot the data on a scatter diagram with the S&P Index on 1327 33 1427 22 1194.18 the vertical axis and CPI on the horizontal axis. b. What can you say about the relationship between the two indexes? What does economic theory have to say about this relationship? 13068 1207 23 1310.46 477.19 2016 2073 c. Consider the following regression model: Source: Economic Report of the President, 2008 Use the method of least squares to estimate this equation form the preceding data and interpret your results. a. Repeat questions (a) to (e) from problem 1 b. Do you see any difference in the estimated regressions? d. Do the results obtained in part (c) make economic sense? e. Do you know why the S&P Index dropped in 1988? c. Now combine the two sets of data and estimate the regression of the S&P 500 index on the CPI d. Are there noticeable differences in the three regressions


