

Answered step by step
Verified Expert Solution
Question
1 Approved Answer
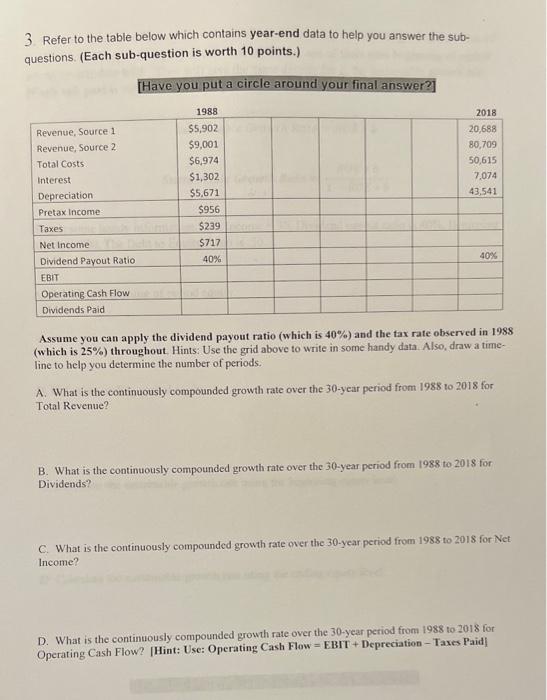
3. Refer to the table below which contains year-end data to help you answer the subquestions. (Each sub-question is worth 10 points.) Assume you can
Step by Step Solution
There are 3 Steps involved in it
Step: 1

Get Instant Access to Expert-Tailored Solutions
See step-by-step solutions with expert insights and AI powered tools for academic success
Step: 2

Step: 3
Ace Your Homework with AI
Get the answers you need in no time with our AI-driven, step-by-step assistance
Get Started
Options Futures And Other Derivatives
Authors: John C. Hull
11th Edition
013693997X, 9780136939979