Answered step by step
Verified Expert Solution
Link Copied!

Question

1 Approved Answer

3. Regression: Input return to Production (16 marks) A market analyst has recently gathered a dataset about the NZ dairy industry regarding the stocking rate
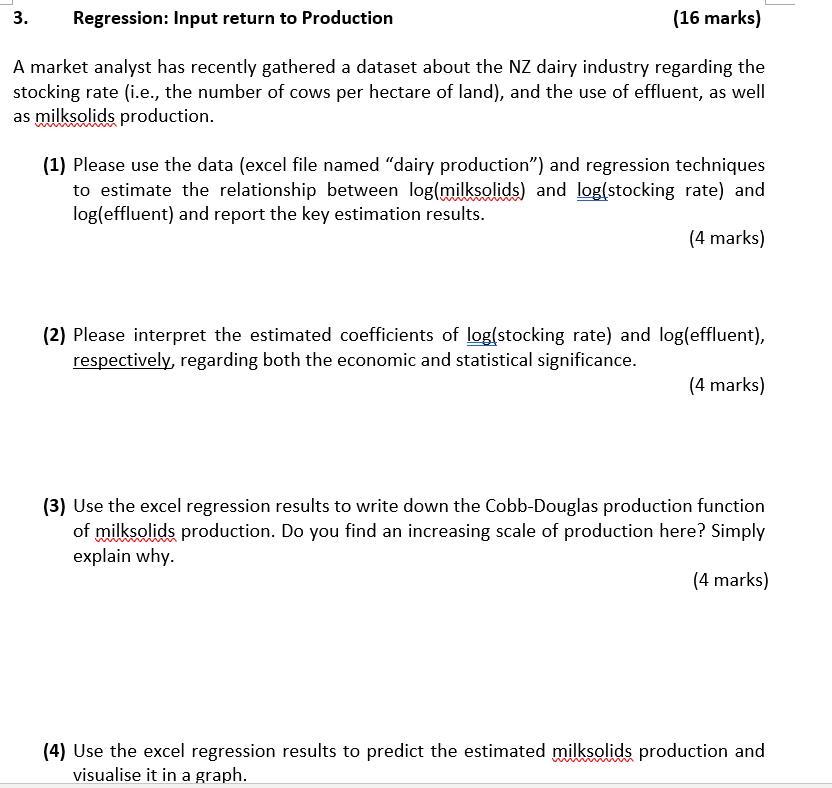
image text in transcribed

3. Regression: Input return to Production (16 marks) A market analyst has recently gathered a dataset about the NZ dairy industry regarding the stocking rate (i.e., the number of cows per hectare of land), and the use of effluent, as well as milksolids production. (1) Please use the data (excel file named "dairy production") and regression techniques to estimate the relationship between log(milksolids) and log(stockingrate)and log( effluent) and report the key estimation results. (4 marks) (2) Please interpret the estimated coefficients of log(stockingrate)andlog(effluent), respectively, regarding both the economic and statistical significance. (4 marks) (3) Use the excel regression results to write down the Cobb-Douglas production function of milksolids production. Do you find an increasing scale of production here? Simply explain why. (4 marks) (4) Use the excel regression results to predict the estimated milksolids production and visualise it in a graph. 3. Regression: Input return to Production (16 marks) A market analyst has recently gathered a dataset about the NZ dairy industry regarding the stocking rate (i.e., the number of cows per hectare of land), and the use of effluent, as well as milksolids production. (1) Please use the data (excel file named "dairy production") and regression techniques to estimate the relationship between log(milksolids) and log(stockingrate)and log( effluent) and report the key estimation results. (4 marks) (2) Please interpret the estimated coefficients of log(stockingrate)andlog(effluent), respectively, regarding both the economic and statistical significance. (4 marks) (3) Use the excel regression results to write down the Cobb-Douglas production function of milksolids production. Do you find an increasing scale of production here? Simply explain why. (4 marks) (4) Use the excel regression results to predict the estimated milksolids production and visualise it in a graph

Step by Step Solution

There are 3 Steps involved in it

Step: 1

blur-text-image

Get Instant Access to Expert-Tailored Solutions

See step-by-step solutions with expert insights and AI powered tools for academic success

Step: 2

blur-text-image

Step: 3

blur-text-image

Ace Your Homework with AI

Get the answers you need in no time with our AI-driven, step-by-step assistance

Get Started

Recommended Textbook for

IT Security Risk Control Management An Audit Preparation Plan

Authors: Raymond Pompon

1st Edition

1484221397, 978-1484221396

More Books

Students also viewed these Accounting questions

Question

How do sex and race influence the leading causes of death?

Answered: 1 week ago

Question

Write a note on job design.

Answered: 1 week ago

Question

Compute the derivative of f(x)cos(-4/5x)

Answered: 1 week ago

Question

Discuss the process involved in selection.

Answered: 1 week ago

Question

Differentiate tan(7x+9x-2.5)

Answered: 1 week ago