| 3. Salesforce.com made over $1 billion in the year ended 1/31/2019, but much less in the other two years. Why (probably more than 1 reason)? |
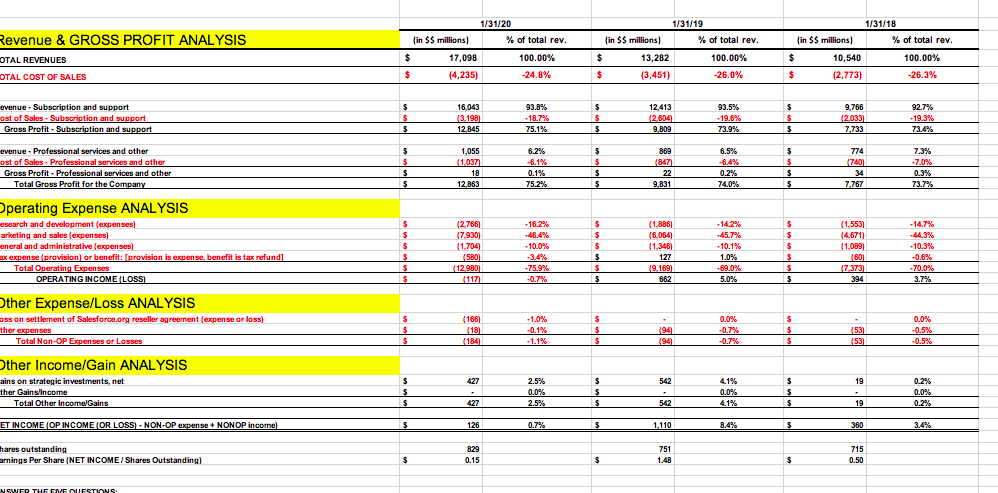
1/31/20 % of total rev. in $$ millions) Revenue & GROSS PROFIT ANALYSIS OTAL REVENUES OTAL COST OF SALES 1/31/19 in $$ millions) % of total rev. $ 13,282 100.00% $ (3,451) -26.0% 1/31/18 in $$ millions) % of total rev. $ 10,540 100.00% $ (2,773) -26.3% $ 17,098 (4,235) 100.00% -24.8% $ evenue. Subscription and support ost of Sales - Subscription and support Gross Profit . Subscription and support S $ $ 16,043 (3,198 12.845 93.8% -18.7% 75.1% $ $ $ 12,413 12.604 9,809 93.5% -19.6% 73.925 $ $ $ 9,766 12.033) 7,733 92.7% -19.3% 73.4% evenue - Professional services and other ost of Sales - Professional services and other Gross Profit - Professional services and other Total Gross Profit for the Company $ $ $ $ 1,055 (1.037 18 12.863 6.2% -6.1% 0.1% 75.2% $ $ $ $ 869 (847) 22 9,831 6.5% -6.4% 0.2% 74.0% $ $ $ s 774 (740) 34 7.767 7.3% -7.0% 0.3% 73.7% Operating Expense ANALYSIS esearch and development (expenses arketing and sales expenses) eneral and administrative expenses sk expense (provision) or benefit: (provision is expense, benefit is tax refund) Total Operating Expenses OPERATING INCOME LOSS $ $ $ $ $ $ $ (2.766) (7.9301 (1,704 (580) (12.980 - 16.2% -46.4% - 10.0% $ $ 5 $ $ $ $ (1,886) (6.084 (1.346) 127 19.169 662 -14.2% -45.7% .10.1% 1.0% -69.0% 5.0% $ $ $ $ $ $ (1,553) (4.671) (1,089) (60) () (7.373 394 .14.7% -44.3% -10.3% -0.6% -70.0% 3.7% -75.9% -0.7% Other Expense/Loss ANALYSIS oss on settlement of Salesforce.org reseller agreement (expense or loss) ther expenses Total Non-OP Expenses or Losses 0.0% $ $ $ (166) (18) (184) -1.0% -0.1% -1.1% $ $ $ (94 0.0% -0.7% -0.7% $ $ $ $ (53) (53) -0.5% Other Income/Gain ANALYSIS ains on strategic investments, net ther Gains/Income Total Other Income Gains $ 427 542 $ 19 $ $ 2.5% 0.0% 2.5% $ $ $ 4.1% 0.0% 4.1% $ $ 0.2% 0.0% 0.2% 427 542 19 ET INCOME (OP INCOME (OR LOSS). NON-OP expense + NONOP income) $ 126 0.7% 5 1.110 8.4% $ 360 3.4% hares outstanding arnings Per Share NET INCOME / Shares Outstanding) 829 0.15 751 1.48 5 $ 715 0.50 $ $ NSWER THEME OLIESTIONS 1/31/20 % of total rev. in $$ millions) Revenue & GROSS PROFIT ANALYSIS OTAL REVENUES OTAL COST OF SALES 1/31/19 in $$ millions) % of total rev. $ 13,282 100.00% $ (3,451) -26.0% 1/31/18 in $$ millions) % of total rev. $ 10,540 100.00% $ (2,773) -26.3% $ 17,098 (4,235) 100.00% -24.8% $ evenue. Subscription and support ost of Sales - Subscription and support Gross Profit . Subscription and support S $ $ 16,043 (3,198 12.845 93.8% -18.7% 75.1% $ $ $ 12,413 12.604 9,809 93.5% -19.6% 73.925 $ $ $ 9,766 12.033) 7,733 92.7% -19.3% 73.4% evenue - Professional services and other ost of Sales - Professional services and other Gross Profit - Professional services and other Total Gross Profit for the Company $ $ $ $ 1,055 (1.037 18 12.863 6.2% -6.1% 0.1% 75.2% $ $ $ $ 869 (847) 22 9,831 6.5% -6.4% 0.2% 74.0% $ $ $ s 774 (740) 34 7.767 7.3% -7.0% 0.3% 73.7% Operating Expense ANALYSIS esearch and development (expenses arketing and sales expenses) eneral and administrative expenses sk expense (provision) or benefit: (provision is expense, benefit is tax refund) Total Operating Expenses OPERATING INCOME LOSS $ $ $ $ $ $ $ (2.766) (7.9301 (1,704 (580) (12.980 - 16.2% -46.4% - 10.0% $ $ 5 $ $ $ $ (1,886) (6.084 (1.346) 127 19.169 662 -14.2% -45.7% .10.1% 1.0% -69.0% 5.0% $ $ $ $ $ $ (1,553) (4.671) (1,089) (60) () (7.373 394 .14.7% -44.3% -10.3% -0.6% -70.0% 3.7% -75.9% -0.7% Other Expense/Loss ANALYSIS oss on settlement of Salesforce.org reseller agreement (expense or loss) ther expenses Total Non-OP Expenses or Losses 0.0% $ $ $ (166) (18) (184) -1.0% -0.1% -1.1% $ $ $ (94 0.0% -0.7% -0.7% $ $ $ $ (53) (53) -0.5% Other Income/Gain ANALYSIS ains on strategic investments, net ther Gains/Income Total Other Income Gains $ 427 542 $ 19 $ $ 2.5% 0.0% 2.5% $ $ $ 4.1% 0.0% 4.1% $ $ 0.2% 0.0% 0.2% 427 542 19 ET INCOME (OP INCOME (OR LOSS). NON-OP expense + NONOP income) $ 126 0.7% 5 1.110 8.4% $ 360 3.4% hares outstanding arnings Per Share NET INCOME / Shares Outstanding) 829 0.15 751 1.48 5 $ 715 0.50 $ $ NSWER THEME OLIESTIONS