

Answered step by step
Verified Expert Solution
Question
1 Approved Answer
3. Table and Chart Development (20 pts.) a) Draw a stacked bar graph showing the number of students doing their first and second internships in
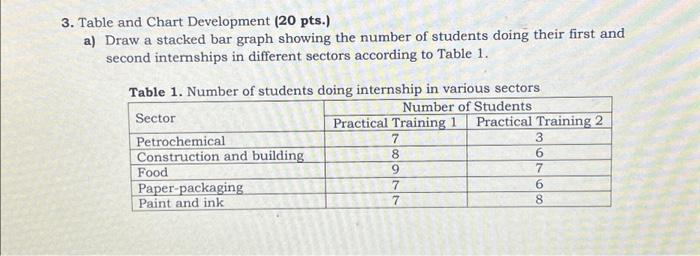
3. Table and Chart Development (20 pts.) a) Draw a stacked bar graph showing the number of students doing their first and second internships in different sectors according to Table 1. Table 1. Number of students doing internship in various sectors Number of Students doing internship in various rector.
Step by Step Solution
There are 3 Steps involved in it
Step: 1

Get Instant Access to Expert-Tailored Solutions
See step-by-step solutions with expert insights and AI powered tools for academic success
Step: 2

Step: 3
Ace Your Homework with AI
Get the answers you need in no time with our AI-driven, step-by-step assistance
Get Started
Analysis Synthesis And Design Of Chemical Processes
Authors: Richard Turton, Joseph Shaeiwitz, Debangsu Bhattacharyya, Wallace Whiting
5th Edition
0134177401, 978-0134177403