

Answered step by step
Verified Expert Solution
Question
1 Approved Answer
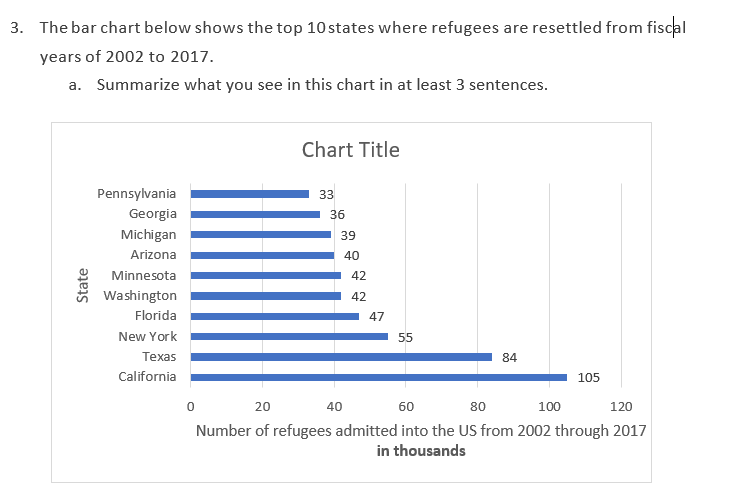
3. The bar chart below shows the top 10states where refugees are resettled from fiscal years of 2002 to 2017. a. Summarize what you see
Step by Step Solution
There are 3 Steps involved in it
Step: 1

Get Instant Access to Expert-Tailored Solutions
See step-by-step solutions with expert insights and AI powered tools for academic success
Step: 2

Step: 3
Ace Your Homework with AI
Get the answers you need in no time with our AI-driven, step-by-step assistance
Get Started
Precalculus Concepts Through Functions, A Unit Circle Approach To Trigonometry
Authors: Michael Sullivan, Michael Sullivan III
3rd Edition
0321925866, 9780321925862