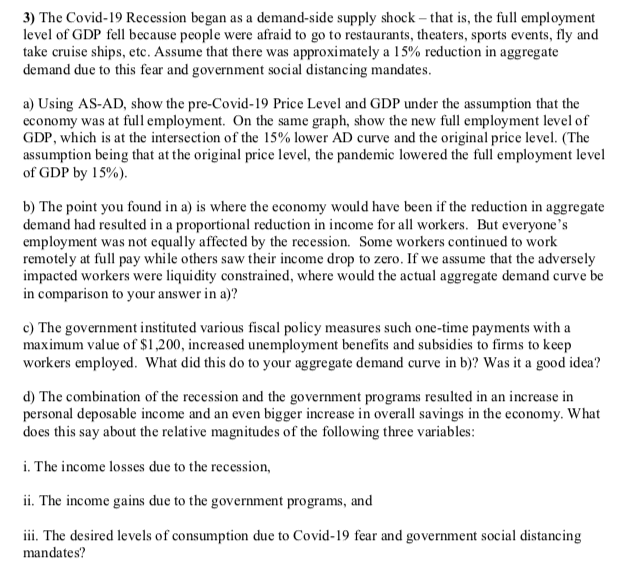
3) The Covid-19 Recession began as a demand-side supply shock - that is, the full employment level of GDP fell because people were afraid to go to restaurants, theaters, sports events, fly and take cruise ships, etc. Assume that there was approximately a 15% reduction in aggregate demand due to this fear and government social distancing mandates. a) Using AS-AD, show the pre-Covid-19 Price Level and GDP under the assumption that the economy was at full employment. On the same graph, show the new full employment level of GDP, which is at the intersection of the 15% lower AD curve and the original price level. (The assumption being that at the original price level, the pandemic lowered the full employment level of GDP by 15%). b) The point you found in a) is where the economy would have been if the reduction in aggregate demand had resulted in a proportional reduction in income for all workers. But everyone's employment was not equally affected by the recession. Some workers continued to work remotely at full pay while others saw their income drop to zero. If we assume that the adversely impacted workers were liquidity constrained, where would the actual aggregate demand curve be in comparison to your answer in a)? c) The government instituted various fiscal policy measures such one-time payments with a maximum value of $1,200, increased unemployment benefits and subsidies to firms to keep workers employed. What did this do to your aggregate demand curve in b)? Was it a good idea? d) The combination of the recession and the government programs resulted in an increase in personal deposable income and an even bigger increase in overall savings in the economy. What does this say about the relative magnitudes of the following three variables: i. The income losses due to the recession, ii. The income gains due to the government programs, and iii. The desired levels of consumption due to Covid-19 fear and government social distancing mandates? 3) The Covid-19 Recession began as a demand-side supply shock - that is, the full employment level of GDP fell because people were afraid to go to restaurants, theaters, sports events, fly and take cruise ships, etc. Assume that there was approximately a 15% reduction in aggregate demand due to this fear and government social distancing mandates. a) Using AS-AD, show the pre-Covid-19 Price Level and GDP under the assumption that the economy was at full employment. On the same graph, show the new full employment level of GDP, which is at the intersection of the 15% lower AD curve and the original price level. (The assumption being that at the original price level, the pandemic lowered the full employment level of GDP by 15%). b) The point you found in a) is where the economy would have been if the reduction in aggregate demand had resulted in a proportional reduction in income for all workers. But everyone's employment was not equally affected by the recession. Some workers continued to work remotely at full pay while others saw their income drop to zero. If we assume that the adversely impacted workers were liquidity constrained, where would the actual aggregate demand curve be in comparison to your answer in a)? c) The government instituted various fiscal policy measures such one-time payments with a maximum value of $1,200, increased unemployment benefits and subsidies to firms to keep workers employed. What did this do to your aggregate demand curve in b)? Was it a good idea? d) The combination of the recession and the government programs resulted in an increase in personal deposable income and an even bigger increase in overall savings in the economy. What does this say about the relative magnitudes of the following three variables: i. The income losses due to the recession, ii. The income gains due to the government programs, and iii. The desired levels of consumption due to Covid-19 fear and government social distancing mandates


