Answered step by step
Verified Expert Solution
Link Copied!

Question

1 Approved Answer

3) The following 3 charts (from top to bottom) show: a parent population for some non- normal random variable ABC; sampling distribution of sample means
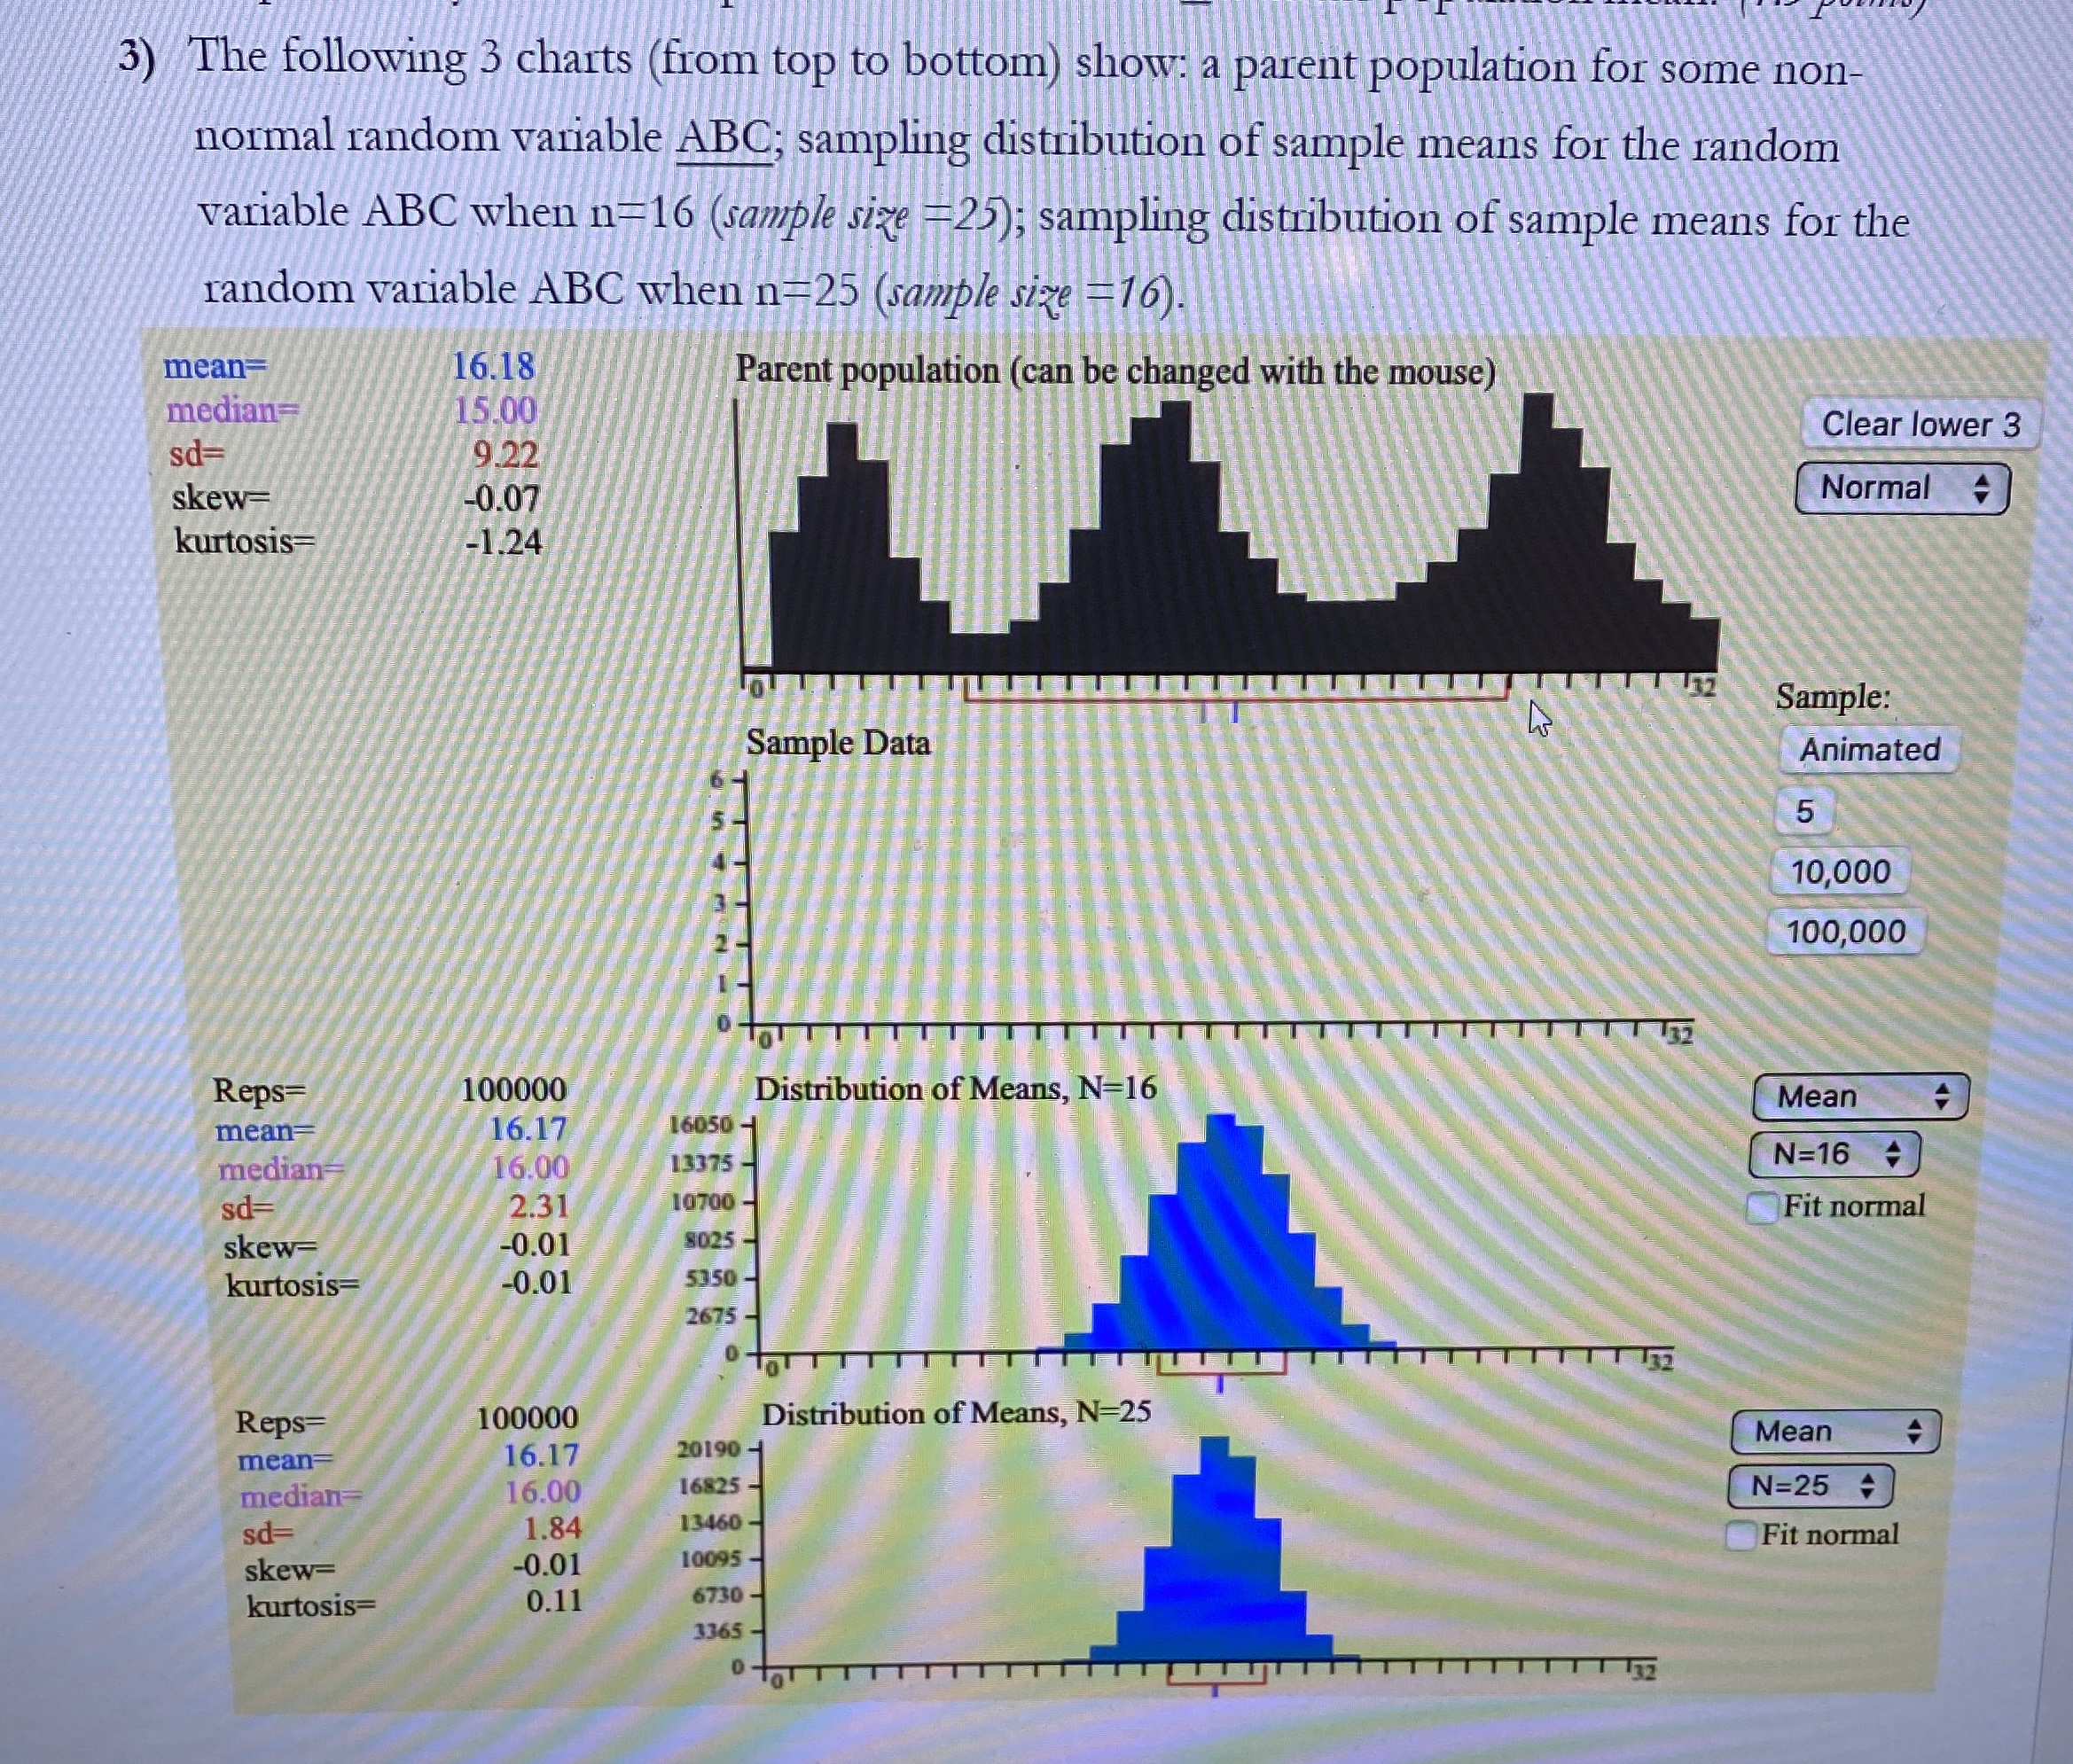
image text in transcribed
3) The following 3 charts (from top to bottom) show: a parent population for some non- normal random variable ABC; sampling distribution of sample means for the random variable ABC when n-16 (sample size -25); sampling distribution of sample means for the random variable ABC when n=25 (sample size -16). mean= 16.18 15,00 Parent population (can be changed with the mouse) median= sd= 9.22 Clear lower 3 skew= -0.07 Normal kurtosis= -1.24 Sample: Sample Data Animated 5 10,000 100,000 32 Reps= 100000 Distribution of Means, N=16 mean 16.17 16050 - Mean median 16.00 13375- N=16 + sd- 2.31 10700 - Fit normal skew= -0.01 8025 - kurtosis= -0.01 5350 - 2675 - O TOT TITTIT 132 Reps= 100000 Distribution of Means, N=25 mean= 16.17 20190 - Mean 4 median 16.00 16825 - N=25 4 sd= 1.84 13460 - Fit normal skew= 0.01 10095 - kurtosis= 0.11 6730 - 3365 - TOT TT TTTTTT32

Step by Step Solution

There are 3 Steps involved in it

Step: 1

blur-text-image

Get Instant Access to Expert-Tailored Solutions

See step-by-step solutions with expert insights and AI powered tools for academic success

Step: 2

blur-text-image

Step: 3

blur-text-image

Ace Your Homework with AI

Get the answers you need in no time with our AI-driven, step-by-step assistance

Get Started

Recommended Textbook for

Quantitative Analysis For Management

Authors: Barry Render, Ralph M. Stair, Michael E. Hanna

11th Edition

9780132997621, 132149117, 132997622, 978-0132149112

Students also viewed these Mathematics questions