

Answered step by step
Verified Expert Solution
Question
1 Approved Answer
3. The following are the sales for three offices of Dunder-Mifflin, a paper distribution company, for the 2013 and 2014 ycars (in thousands of dollars)
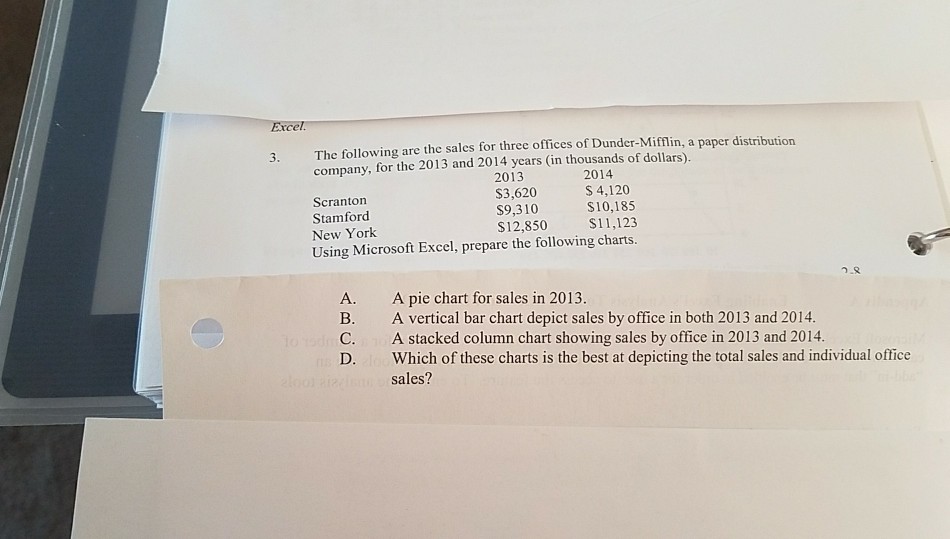
3. The following are the sales for three offices of Dunder-Mifflin, a paper distribution company, for the 2013 and 2014 ycars (in thousands of dollars) Scranton Stamford New York Using Microsoft Excel, prepare the following charts. 2013 $3,620 $9,310 $12,850 2014 S 4,120 S10,185 $11,123 A. A pie chart for sales in 2013. B. A vertical bar chart depict sales by office in both 2013 and 2014. C. A stacked column chart showing sales by office in 2013 and 2014 D. Which of these charts is the best at depicting the total sales and individual office sales
Step by Step Solution
There are 3 Steps involved in it
Step: 1

Get Instant Access to Expert-Tailored Solutions
See step-by-step solutions with expert insights and AI powered tools for academic success
Step: 2

Step: 3
Ace Your Homework with AI
Get the answers you need in no time with our AI-driven, step-by-step assistance
Get Started
The Lean Audit A Detailed User Guide For The Lean Factory Audit Online
Authors: Isaias Wallaker
1st Edition
B09R3HXJ11, 979-8408651320