

Answered step by step
Verified Expert Solution
Question
1 Approved Answer
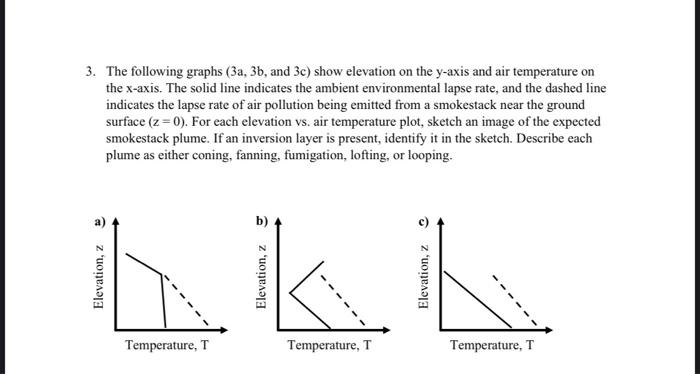
3. The following graphs ( 3a,3b, and 3c) show elevation on the y-axis and air temperature on the x-axis. The solid line indicates the ambient
Step by Step Solution
There are 3 Steps involved in it
Step: 1

Get Instant Access to Expert-Tailored Solutions
See step-by-step solutions with expert insights and AI powered tools for academic success
Step: 2

Step: 3
Ace Your Homework with AI
Get the answers you need in no time with our AI-driven, step-by-step assistance
Get Started
Chemical Engineering For Non Chemical Engineers
Authors: Jack Hipple
1st Edition
1119169585, 978-1119169581