

Answered step by step
Verified Expert Solution
Question
1 Approved Answer
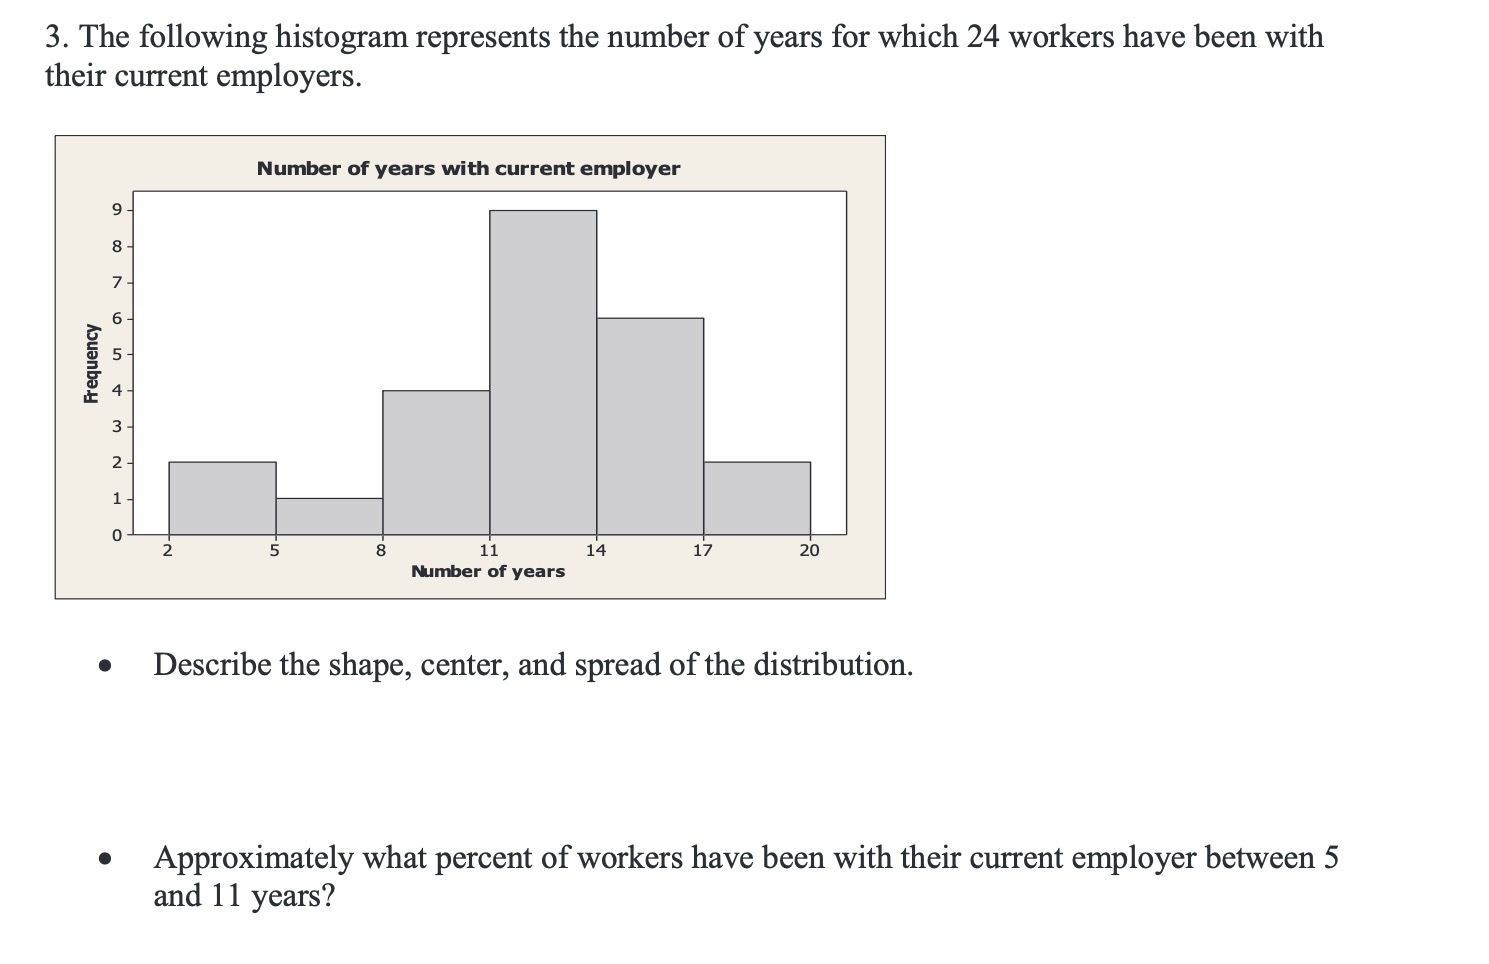
3. The following histogram represents the number of years for which 24 workers have been with their current employers. Hunter of years with current enmloyer
Step by Step Solution
There are 3 Steps involved in it
Step: 1

Get Instant Access to Expert-Tailored Solutions
See step-by-step solutions with expert insights and AI powered tools for academic success
Step: 2

Step: 3
Ace Your Homework with AI
Get the answers you need in no time with our AI-driven, step-by-step assistance
Get Started
Shape Optimization And Optimal Design
Authors: John Cagnol
1st Edition
0824705564, 978-0824705565