Answered step by step
Verified Expert Solution
Link Copied!

Question

1 Approved Answer

3. The following is the average daily maximum temperature and average daily minimum temperature for Los Angeles. Make a double line graph. - two lines
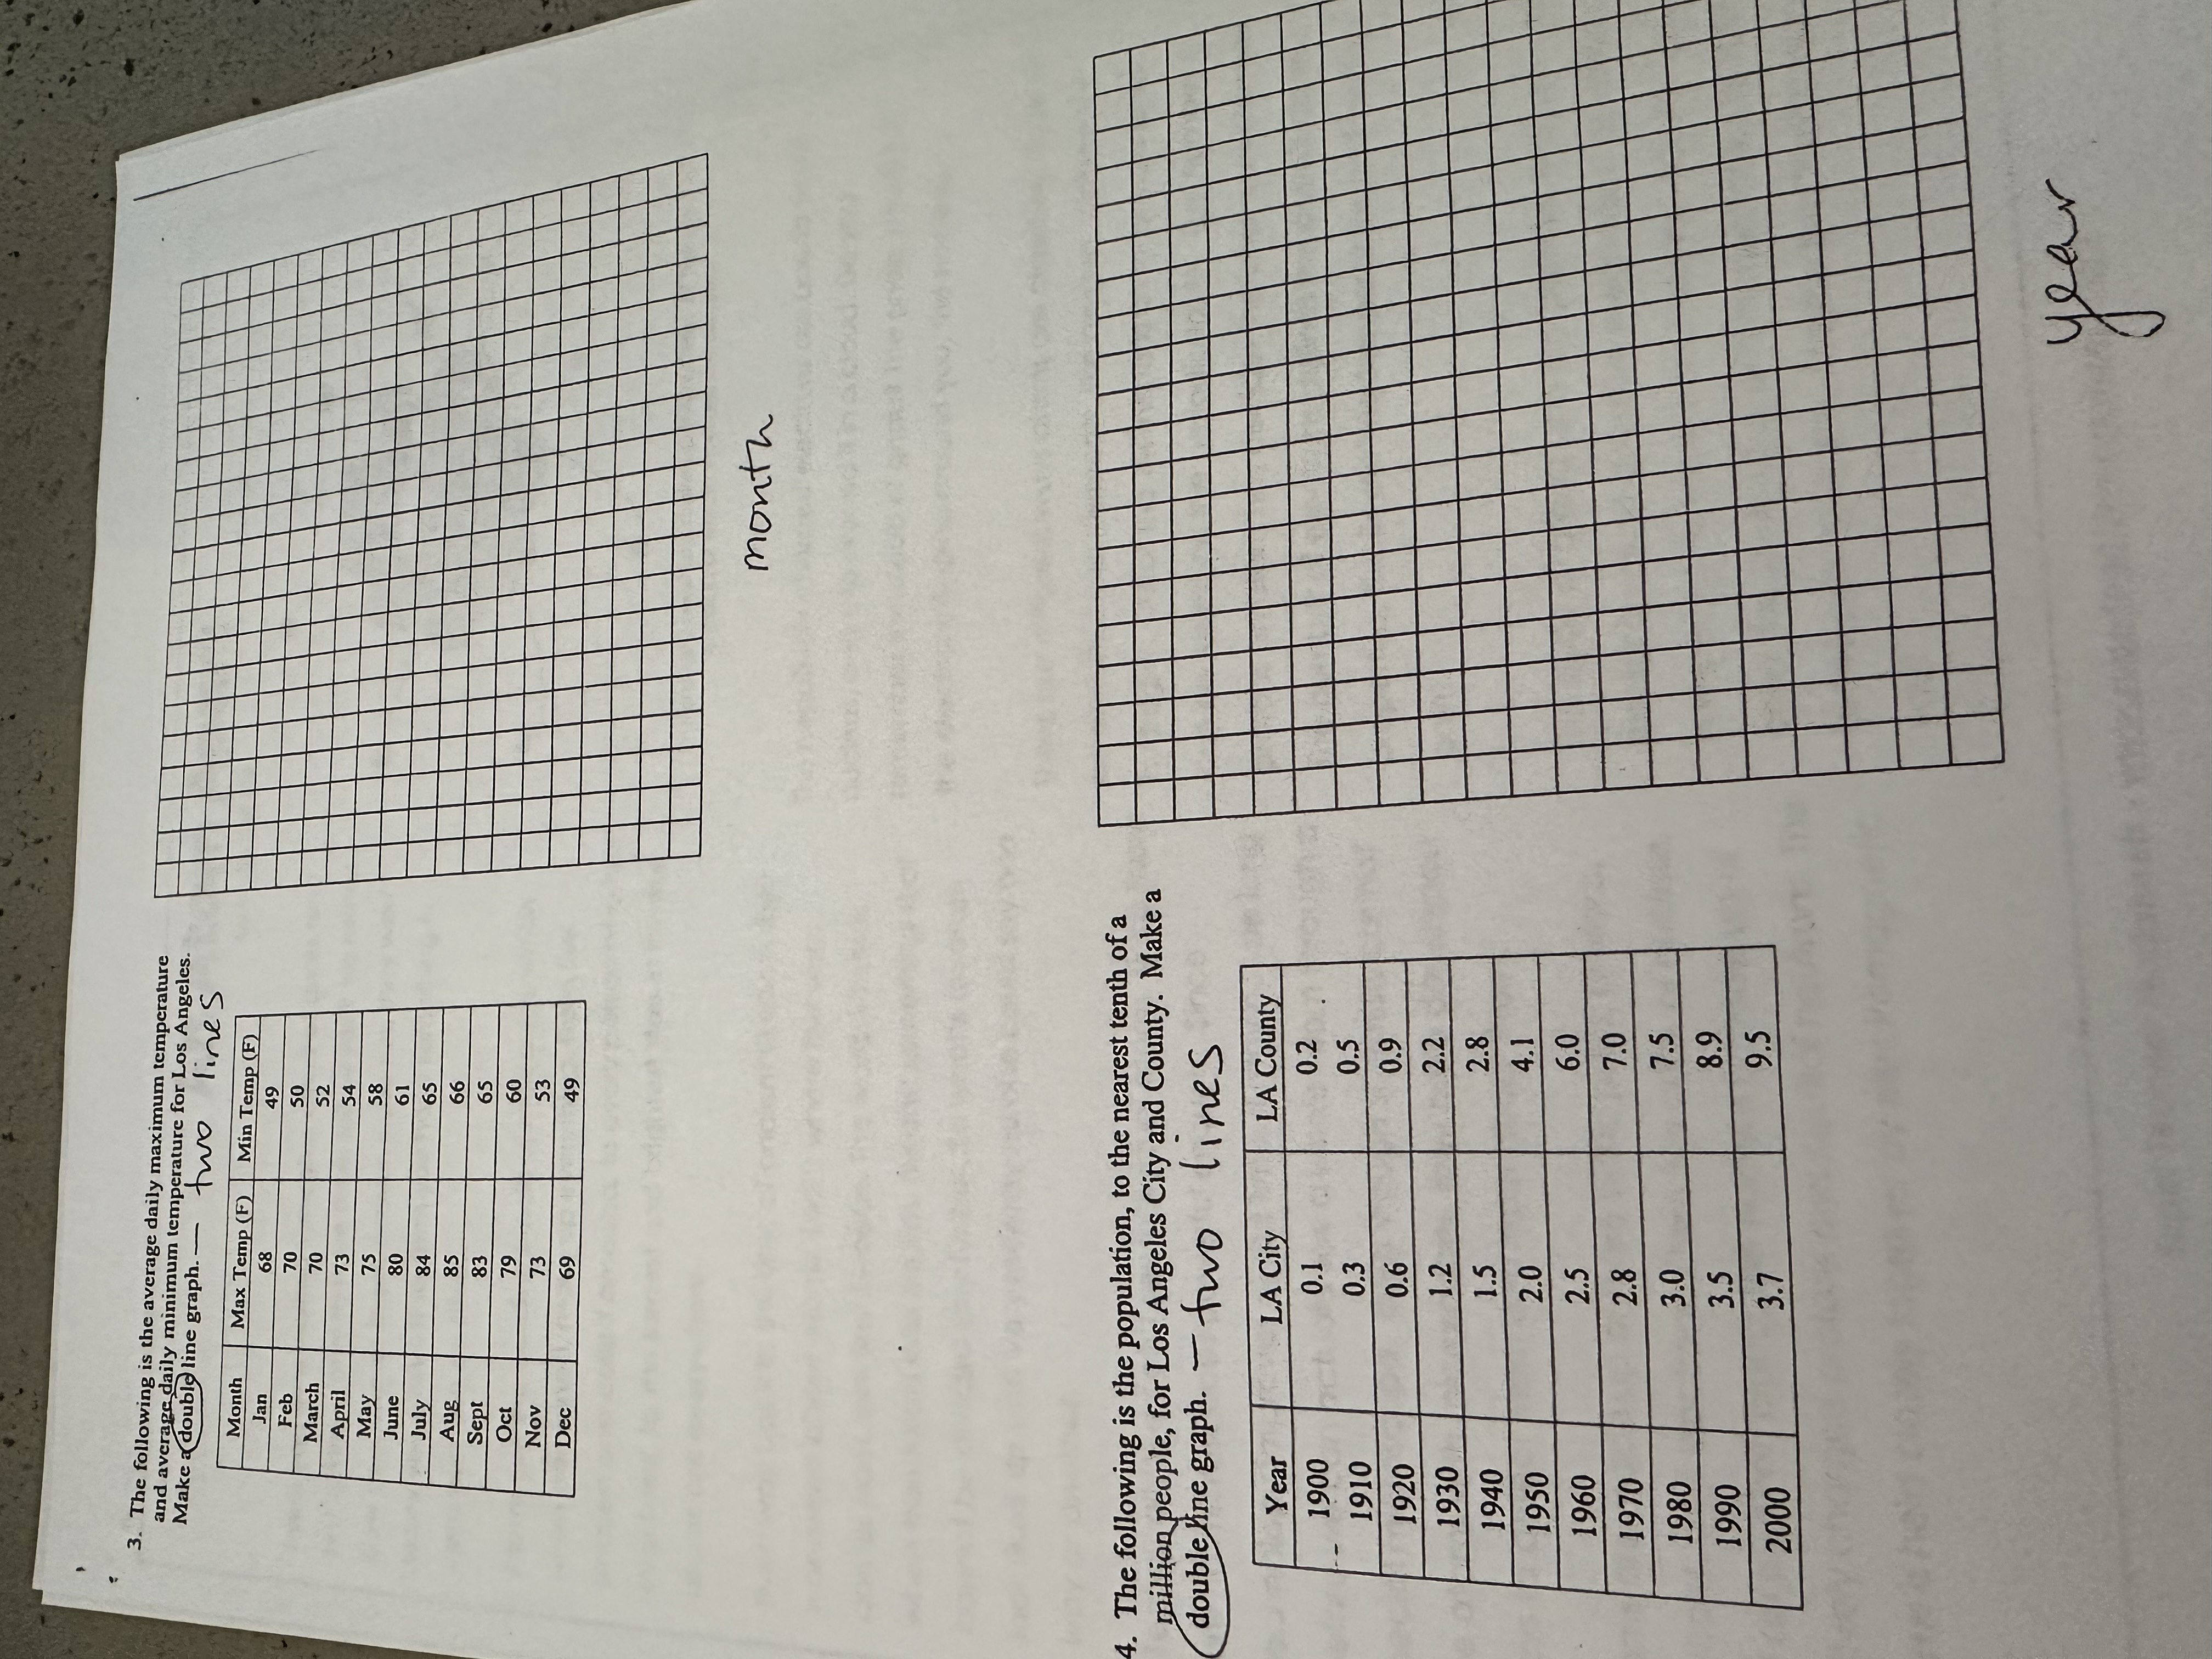
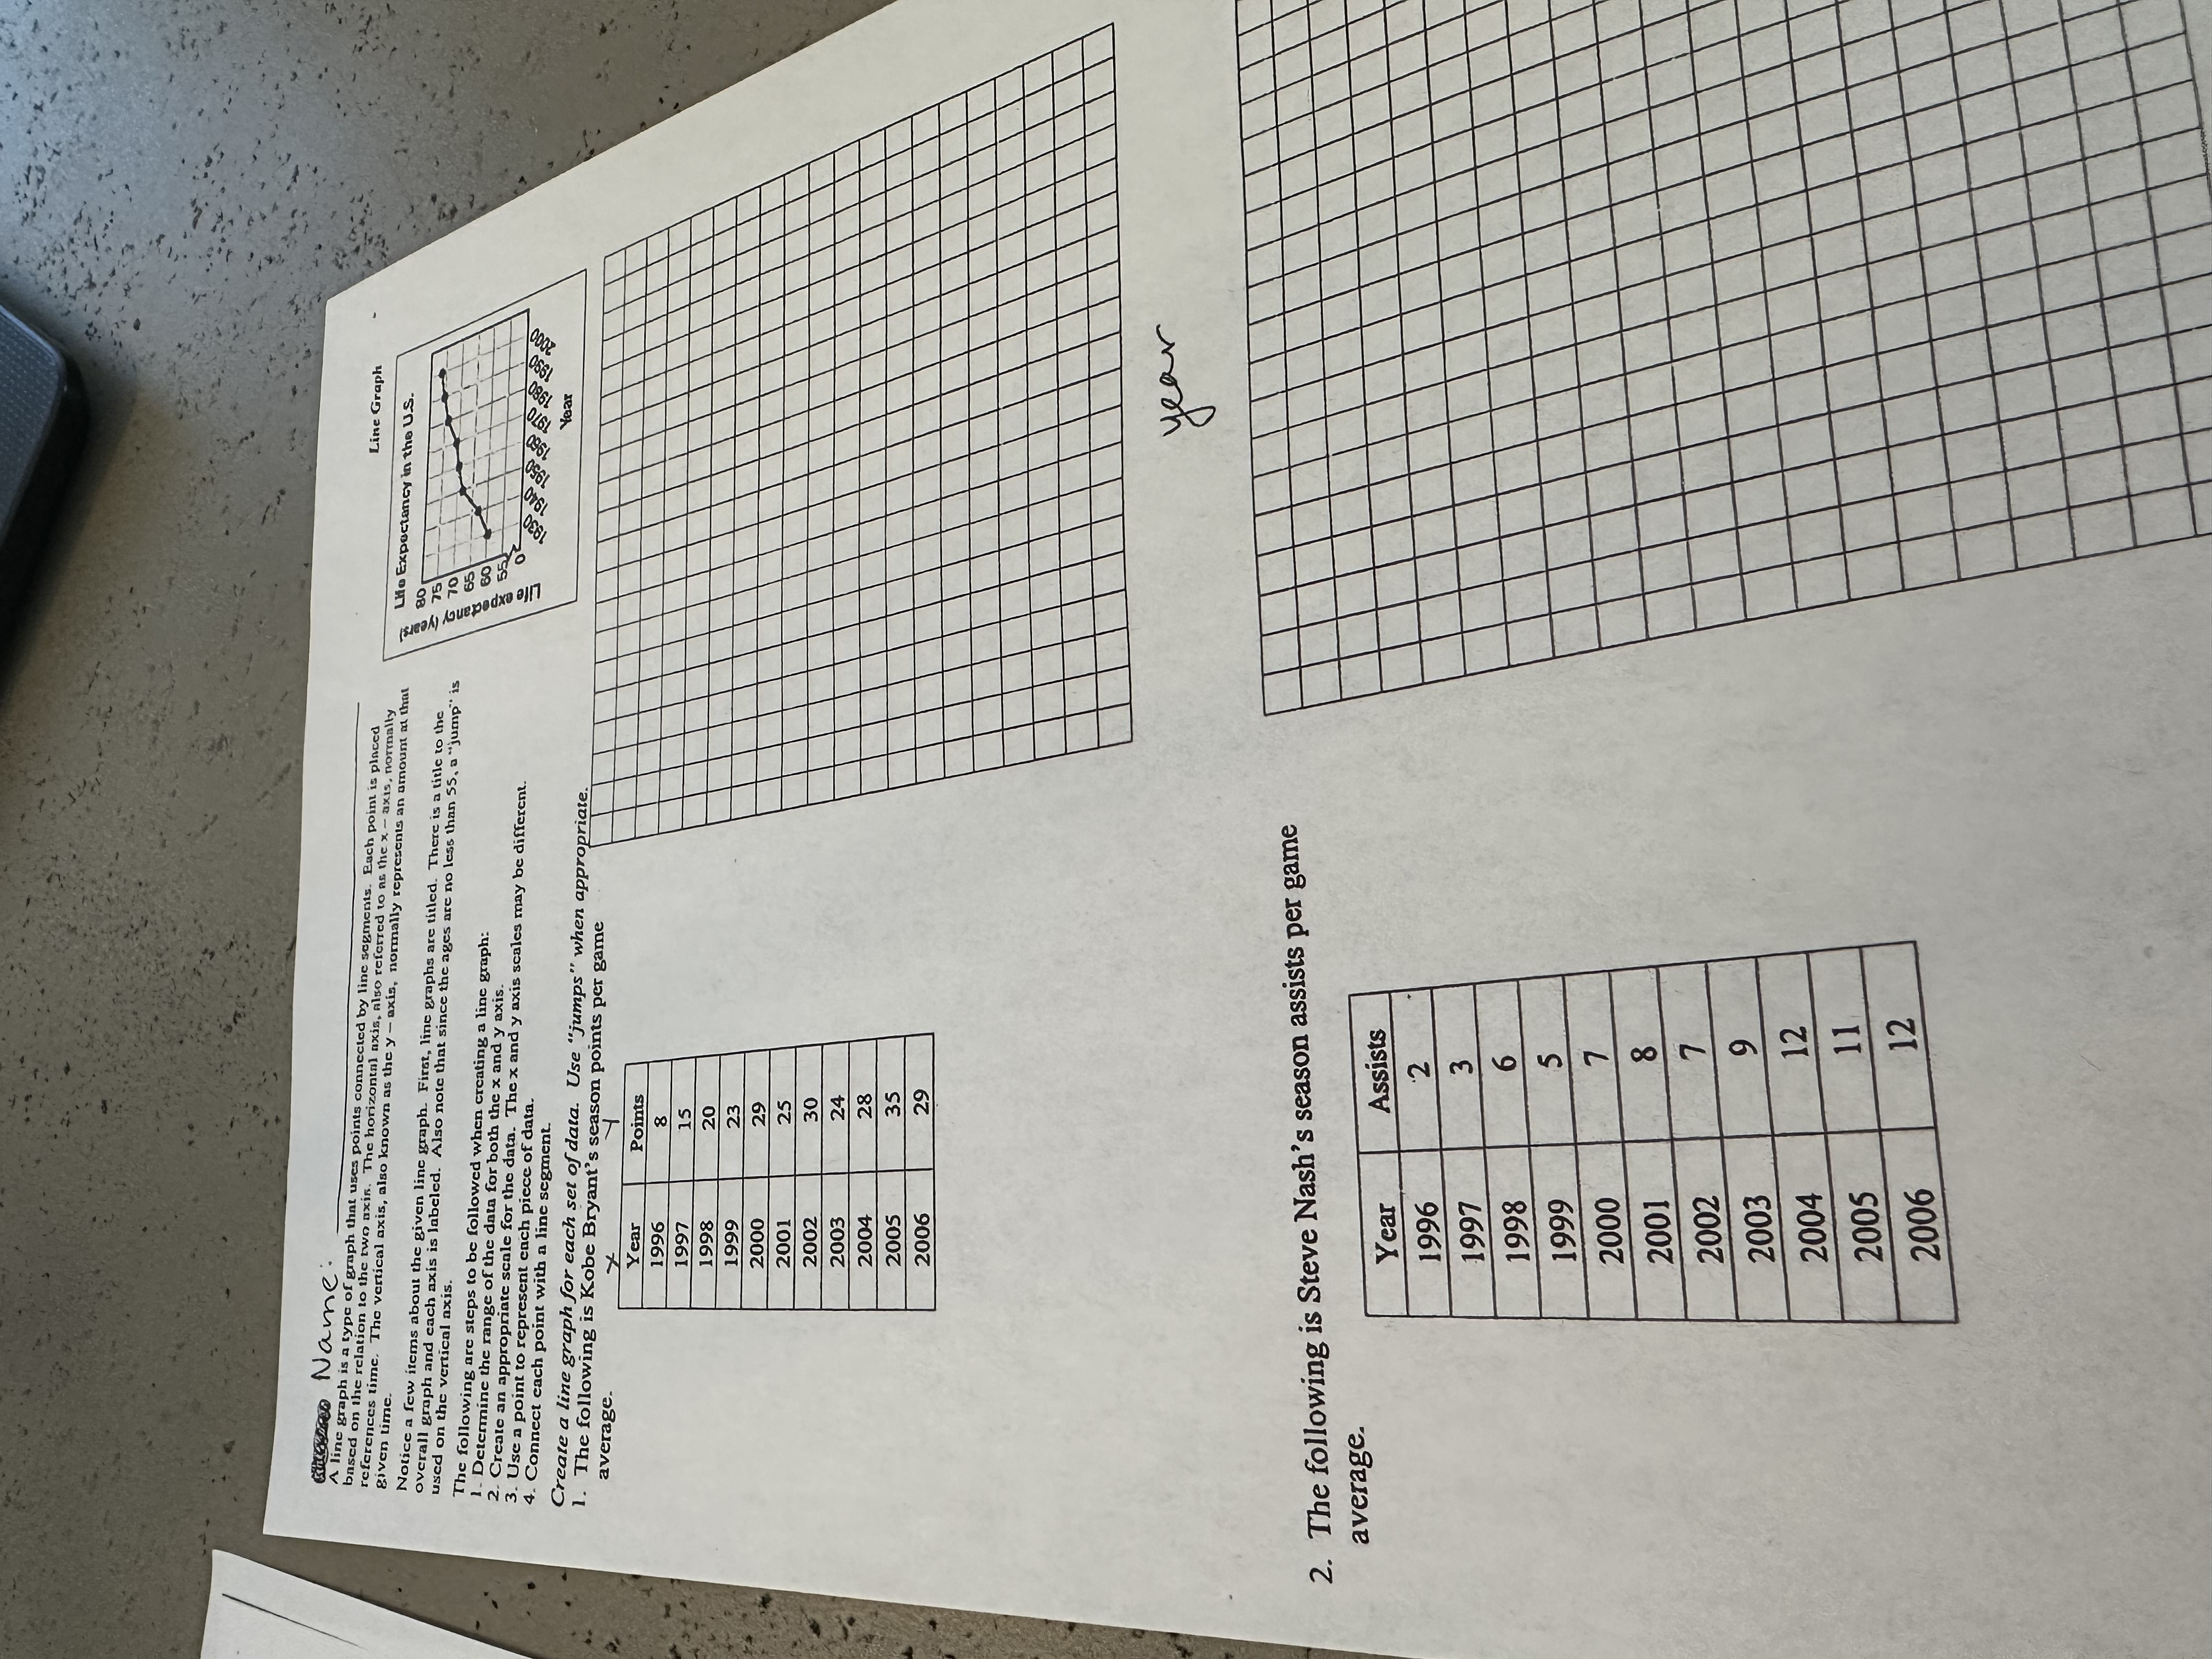
image text in transcribedimage text in transcribed
3. The following is the average daily maximum temperature and average daily minimum temperature for Los Angeles. Make a double line graph. - two lines Month Max Temp (F) Min Temp (F) Jan 68 Feb 49 70 March 50 70 52 April 73 54 May 75 58 June 80 61 July 84 65 Aug 85 66 Sept 83 65 Oct 79 60 Nov 73 53 Dec 69 49 month 4. The following is the population, to the nearest tenth of a million people, for Los Angeles City and County. Make a double line graph. -two lines Year LA City LA County 1900 0.1 0.2 1910 0.3 0.5 1920 0.6 0.9 1930 1.2 2.2 1.5 2.8 1940 950 2.0 4.1 1960 2.5 6.0 1970 2.8 7.0 1980 3.0 7.5 1990 3.5 8.9 2000 3.7 9.5 yearthen Name. line graph is a type of graph given time. used on the relation to the two axis. The horizon mea offline segments. Bach point is placed references time. The vertical axis, also known as the y - axis, normally represents an amount at that Line Graph Notice a few items about the given overall graph Ho Expectancy in the U.S. even line graph. First, line graphs are titled. There is a title to the ll graph and cach axis is labeled. Also note that since the ages are no less than $5, a "jump" is used on the vertical axis. The following are steps to be followed when creating a line graph Life expectancy (years Determine the range of the data for both the x and y axis. 2. Create an appropriate scale for the data. The x and y axis scales may be different. 3. Use a point to represent cach piece of data. 4. Connect cach point with a line segment. Create a line graph for each set of data. Use "jumps" when appropriate Year average. 1. The following is Kobe Bryant's season points per game Year Points 1996 1997 8 15 1998 20 1999 23 2000 29 2001 25 2002 30 2003 24 2004 28 2005 35 2006 29 year 2. The following is Steve Nash's season assists per game average. Year Assists 1996 2 1997 3 1998 6 1999 5 2000 7 2001 8 2002 7 2003 9 2004 12 2005 11 2006 12

Step by Step Solution

There are 3 Steps involved in it

Step: 1

blur-text-image

Get Instant Access to Expert-Tailored Solutions

See step-by-step solutions with expert insights and AI powered tools for academic success

Step: 2

blur-text-image

Step: 3

blur-text-image

Ace Your Homework with AI

Get the answers you need in no time with our AI-driven, step-by-step assistance

Get Started

Recommended Textbook for

Elementary Technical Mathematics

Authors: Dale Ewen

12th Edition

1337630586, 978-1337630580

More Books

Students also viewed these Mathematics questions

Question

What is topology? Explain with examples

Answered: 1 week ago

Question

What is linear transformation? Define with example

Answered: 1 week ago