Answered step by step
Verified Expert Solution
Question
1 Approved Answer
3. The following rates are actual yields on US yield curve observed on the dates given: Date 1 Mo 2 Mo 3 Mo 6 Mo
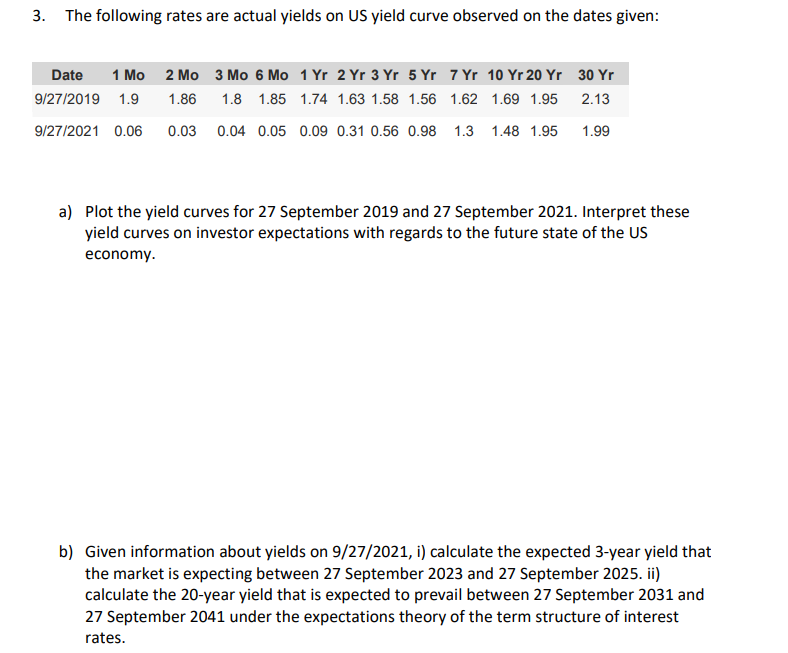
3. The following rates are actual yields on US yield curve observed on the dates given: Date 1 Mo 2 Mo 3 Mo 6 Mo 1 Yr 2 Yr 3 Yr 5 Yr 7 Yr 10 Yr 20 Yr 30 Yr 9/27/2019 1.9 1.86 1.8 1.85 1.74 1.63 1.58 1.56 1.62 1.69 1.95 2.13 9/27/2021 0.06 0.03 0.04 0.05 0.09 0.31 0.56 0.98 1.3 1.48 1.95 1.99 a) Plot the yield curves for 27 September 2019 and 27 September 2021. Interpret these yield curves on investor expectations with regards to the future state of the US economy. b) Given information about yields on 9/27/2021, i) calculate the expected 3-year yield that the market is expecting between 27 September 2023 and 27 September 2025. ii) calculate the 20-year yield that is expected to prevail between 27 September 2031 and 27 September 2041 under the expectations theory of the term structure of interest rates
Step by Step Solution
There are 3 Steps involved in it
Step: 1
Get Instant Access to Expert-Tailored Solutions
See step-by-step solutions with expert insights and AI powered tools for academic success
Step: 2
Step: 3
Ace Your Homework with AI
Get the answers you need in no time with our AI-driven, step-by-step assistance
Get Started