

Answered step by step
Verified Expert Solution
Question
1 Approved Answer
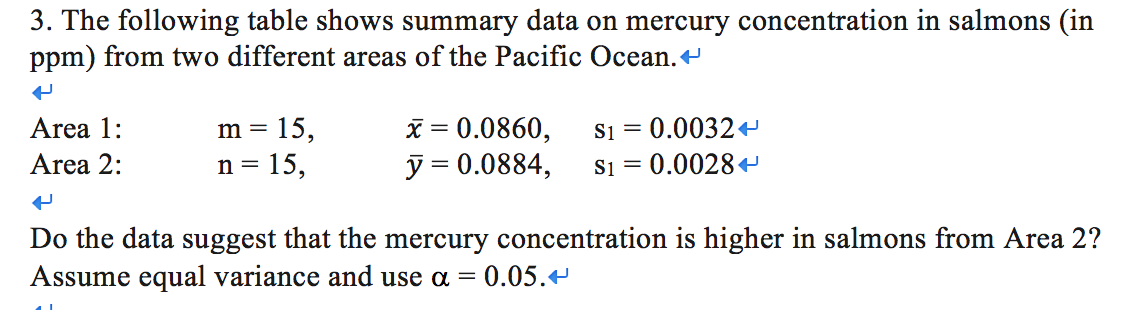
3. The following table shows summary data on mercury concentration in sahnons (in ppm) from two different areas of the Pacic OceanAl .'J Area 1:
Step by Step Solution
There are 3 Steps involved in it
Step: 1

Get Instant Access to Expert-Tailored Solutions
See step-by-step solutions with expert insights and AI powered tools for academic success
Step: 2

Step: 3
Ace Your Homework with AI
Get the answers you need in no time with our AI-driven, step-by-step assistance
Get Started
Discrete Mathematics and Its Applications
Authors: Kenneth H. Rosen
7th edition
0073383090, 978-0073383095