

Answered step by step
Verified Expert Solution
Question
1 Approved Answer
3. The following table shows the past annual returns for Stock A and Stock B, please find the expected return, standard deviation and coefficient of
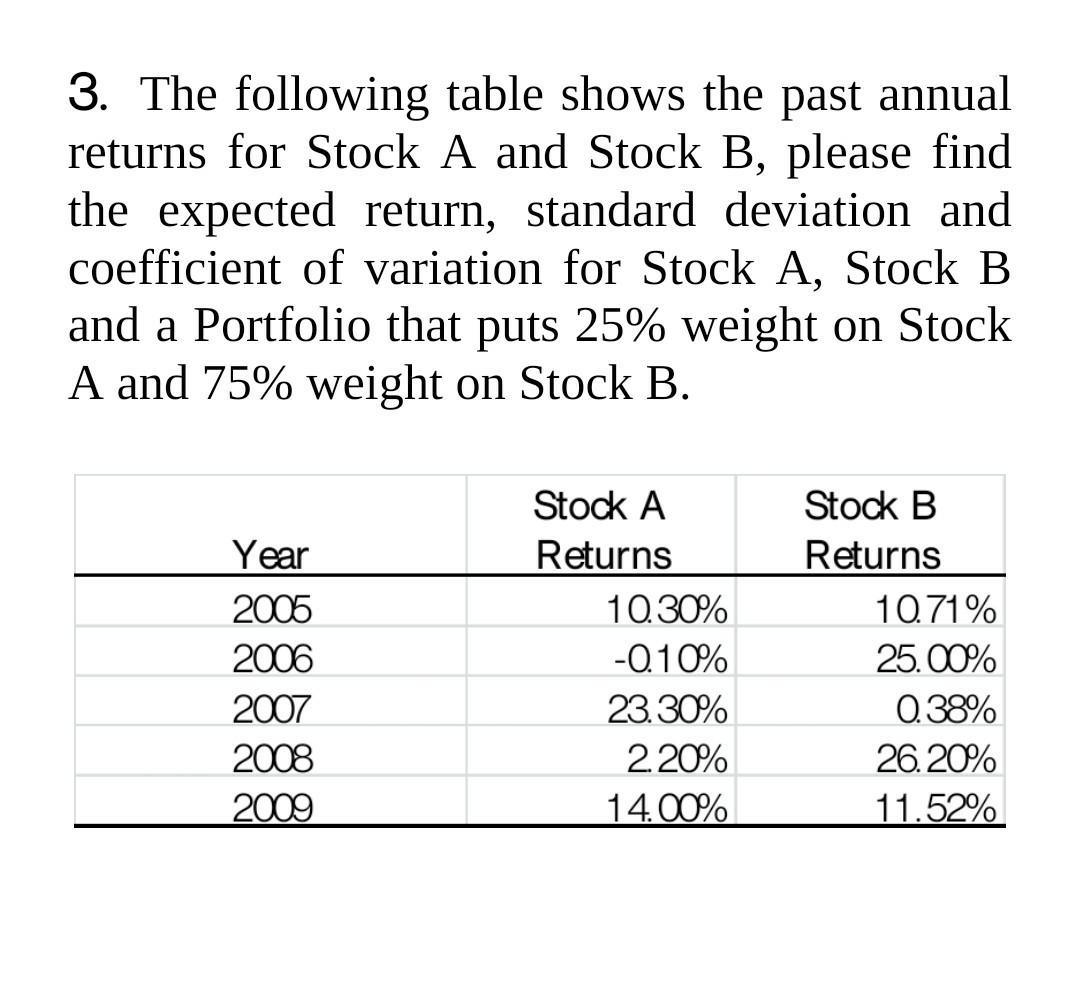
3. The following table shows the past annual returns for Stock A and Stock B, please find the expected return, standard deviation and coefficient of variation for Stock A, Stock B and a Portfolio that puts 25% weight on Stock a A and 75% weight on Stock B. Year 2006 2006 2007 2008 2009 Stock A Returns 10.30% -0.10% 23.30% 2.20% 14.00% Stock B Returns 10.71% 25.00% 0.38% 26. 20% 11.52%
Step by Step Solution
There are 3 Steps involved in it
Step: 1

Get Instant Access to Expert-Tailored Solutions
See step-by-step solutions with expert insights and AI powered tools for academic success
Step: 2

Step: 3
Ace Your Homework with AI
Get the answers you need in no time with our AI-driven, step-by-step assistance
Get Started
Millionaire By Thirty The Quickest Path To Early Financial Independence
Authors: Douglas R. Andrew, Emron Andrew, Aaron Andrew
1st Edition
0446501840, 978-0446501842