Answered step by step
Verified Expert Solution
Question
1 Approved Answer
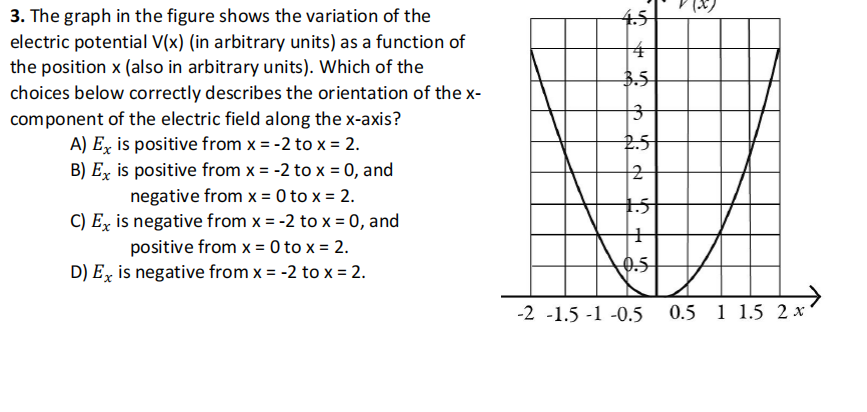
3. The graph in the figure shows the variation of the electric potential V(x) (in arbitrary units) as a function of the position x


3. The graph in the figure shows the variation of the electric potential V(x) (in arbitrary units) as a function of the position x (also in arbitrary units). Which of the choices below correctly describes the orientation of the x- component of the electric field along the x-axis? A) Ex is positive from x = -2 to x = 2. B) Ex is positive from x = -2 to x = 0, and negative from x = 0 to x = 2. C) Ex is negative from x = -2 to x = 0, and positive from x = 0 to x = 2. D) Ex is negative from x = -2 to x = 2. 4.5 4 3.5 3 2.5 2 15 1 10.5 -2 -1.5-1 -0.5 0.5 1 1.5 2 x 4. An electron is projected from plate A, directly toward plate B, with an initial velocity of 10 = 2.0 107 m/s, as shown in the figure. The velocity of the electron as it strikes plate B is closest to: A) 1.2 107 m/s B) 2.4 x 10⁷ m/s C) 2.0 x 10⁷ m/s D) 1.8 x 10⁷ m/s E) 1.5 x 10⁷ m/s A E 12,000 N/C Vo 40 mm: B
Step by Step Solution
There are 3 Steps involved in it
Step: 1

Get Instant Access to Expert-Tailored Solutions
See step-by-step solutions with expert insights and AI powered tools for academic success
Step: 2

Step: 3

Ace Your Homework with AI
Get the answers you need in no time with our AI-driven, step-by-step assistance
Get Started


