Answered step by step
Verified Expert Solution
Link Copied!

Question

1 Approved Answer

3) To design a crystallization process, an API was mixed with a given solvent in different proportions. It was found that the solubility curve can
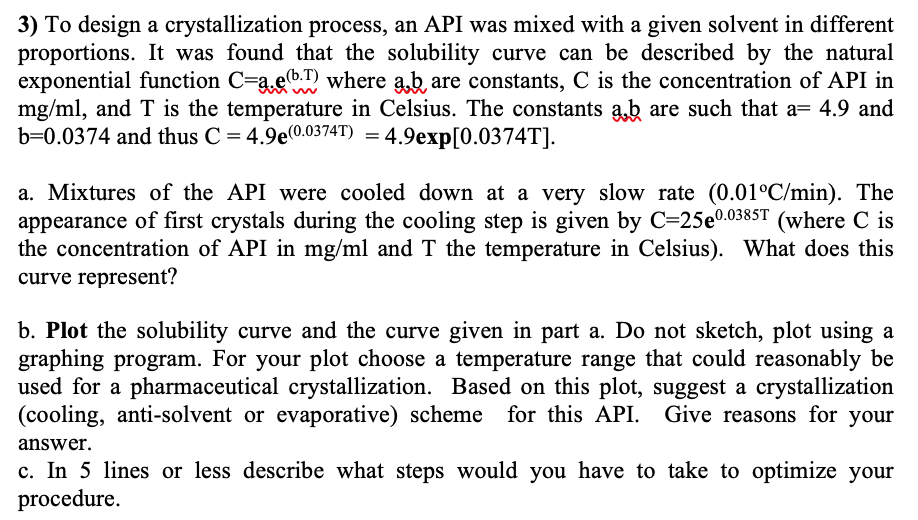
image text in transcribed

3) To design a crystallization process, an API was mixed with a given solvent in different proportions. It was found that the solubility curve can be described by the natural exponential function C=a1e(bT) where abb are constants, C is the concentration of API in mg/ml, and T is the temperature in Celsius. The constants abb are such that a=4.9 and b=0.0374 and thus C=4.9e(0.0374T)=4.9exp[0.0374T] a. Mixtures of the API were cooled down at a very slow rate (0.01C/min). The appearance of first crystals during the cooling step is given by C=25e0.0385T (where C is the concentration of API in mg/ml and T the temperature in Celsius). What does this curve represent? b. Plot the solubility curve and the curve given in part a. Do not sketch, plot using a graphing program. For your plot choose a temperature range that could reasonably be used for a pharmaceutical crystallization. Based on this plot, suggest a crystallization (cooling, anti-solvent or evaporative) scheme for this API. Give reasons for your answer. c. In 5 lines or less describe what steps would you have to take to optimize your

Step by Step Solution

There are 3 Steps involved in it

Step: 1

blur-text-image

Get Instant Access to Expert-Tailored Solutions

See step-by-step solutions with expert insights and AI powered tools for academic success

Step: 2

blur-text-image

Step: 3

blur-text-image

Ace Your Homework with AI

Get the answers you need in no time with our AI-driven, step-by-step assistance

Get Started

Recommended Textbook for

Introduction To Software For Chemical Engineers

Authors: Mariano Martín Martín

2nd Edition

1138324213, 978-1138324213

More Books

Students also viewed these Chemical Engineering questions