3 TraderJoes Q Search Sheet Home Insert Draw Page Layout Formulas Data Review View XLSTAT Cloud StatPlus Data Mining + Share X Cut Times New..
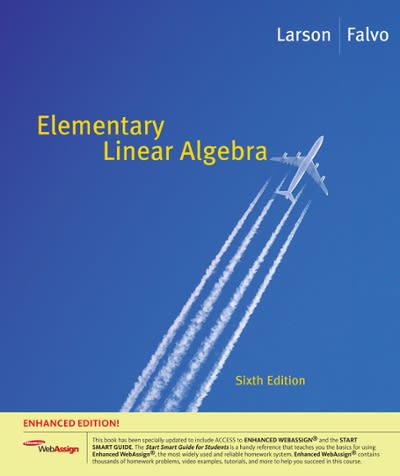
3 TraderJoes Q Search Sheet Home Insert Draw Page Layout Formulas Data Review View XLSTAT Cloud StatPlus Data Mining "+ Share X Cut Times New.. . 12 . A- A Wrap Text General Good AutoSum . Normal Bad Neutral Calculation Copy Fill Paste Merge & Center $ % 2 08 420 Conditional Format Check Cell Explanatory T.. Input Linked Cell Note Insert e Format Clear Find & Format Formatting as Table Sort & Select Al Store W AA AB AC AD AE AF AG AH Al AJ AK AL AM Store Longitude Latitude -123.79 46.1 -123.2 44.58 A W N -122.99 45.52 -122.88 42.33 -122.80 45.49 22.72 45.41 122.69 47.64 -122.64 45.48 -122.64 38.23 -122.64 45.54 22.62 45.53 122.57 45.42 13 122.55 45.62 122.55 47.24 -122.51 45.44 22.50 37.97 -122.49 48.76 122.49 37.68 122.48 37.98 -122.42 37.65 22.41 37.77 -122.40 47.57 -122.39 37.60 122.34 47.74 - 122.34 37.52 22.32 47.32 -122.31 37.53 -122.30 38.32 22.30 47.40 -122.30 47.61 22.29 37.84 -122.29 38.00 -122.28 37.77 22.27 37.85 -122.26 37.51 22.19 47.90 -122.16 37.45 122.14 47.61 22.12 37.89 -122.09 37.38 22.07 37.69 -120 03 37.35 -122.03 38.03 22.02 36.97 -122.02 37.95 -122.00 37.82 -121.99 37.31 -121.97 36.98 121.96 37.24 -121.95 37.28 -121.89 36.60 - 121.88 37.25 -121.86 37.30 -121.76 38.55 -121.70 37.93 21.65 37.13 -121.49 38.58 -121.44 38.57 21.39 38.63 121.32 38.00 21.32 44.06 -121.27 38.64 121.18 38.68 21.02 37.72 -120.71 35.55 66 20.60 35.25 Data Read : -16.00480843Q Search Sheet 3 TraderJoes "+ Share Home Insert Draw Page Layout Formulas Data Review View XLSTAT Cloud StatPlus Data Mining AutoSum . Cut Times New.. . 12 . A- A Wrap Text General Normal Bad Good Neutral Calculation Fill Copy Merge & Center Check Cell Linked Cell Note e Format Find & $ % 2 08 420 Conditional Format Explanatory T... Input Insert Clear Sort & Select Paste BI USA. Formatting as Table Format A68 67 AF AG AH Al AJ AK AL AM W AA AB AC AD AE 68 67 -120.59 -120.44 $4.95 70 -1 19.83 34.44 -119.82 39.53 -119.78 36.74 19.78 39.11 19.76 36.82 -119.73 34.44 -119.73 36.85 -119.68 34.43 -119.04 34.22 19.02 35.38 -119.02 35. 37 -118.91 34.18 -118.87 34 . 22 18.81 34.15 18.76 34.15 -118.64 34.20 -118.59 34.15 -118.52 34.43 -118.50 34.28 18.42 4.04 -118.39 34.02 -118.39 $3.98 -118.39 34 . 14 18.39 33.74 -118.38 34.09 -118.37 33.83 95 -118.37 34.15 -118.37 3.82 97 -118.37 98 -118.36 34.06 99 -118.36 $4.18 100 -118.35 33.84 101 -118.35 4.15 102 118.33 34.10 103 -118.32 34.11 104 -118.31 33.76 105 -118.31 34.18 106 -118.27 $4.19 107 -118.22 34.21 108 -118.21 34.54 109 -118.20 34.14 110 118.20 34.21 111 -118.19 33.83 112 -118.17 34. 14 113 -118.15 34.60 114 -118.14 34.14 115 -118.13 33.75 116 -118.12 33.80 117 -118.08 34.16 118 -118.05 33. 72 119 -1 18.00 34.14 120 -117.97 33.66 121 -117.92 33.65 + 122 -117.91 33. 72 123 -117.90 33.92 124 -117.83 33.60 125 -117.81 33.82 126 -117.8 34.11 127 -117.79 33.89 128 17.72 34.10 129 -117.71 33.52 130 -117.69 34.05 131 -117.64 33.61 132 117.63 33.47 133 -117.59 33.91 Data 5.296704021 ReadQ Search Sheet 3 TraderJoes "+ Share Home Insert Draw Page Layout Formulas Data Review View XLSTAT Cloud StatPlus Data Mining AutoSum . Cut Times New.. . 12 . A- A Wrap Text General Normal Bad Good Neutral Calculation Fill Copy e Format Find & Paste Merge & Center $ ~ % 2 08 420 Conditional Format Check Cell Explanatory T... Input Linked Cell Note Insert Sort & Format Formatting as Table Clear Select A135 134 W AA AB AC AD AE AF AG AH Al AJ AK AL AM 134 117.58 34.18 135 17.41 47.71 136 -117.33 47.59 137 -117.27 32.83 138 -117.27 32.82 139 -117.26 33.05 140 17.25 33.10 141 -117.23 32.79 142 -117.23 32.87 143 -117.2 32.74 144 -117.17 32.75 145 117.11 33.53 146 -117.10 32.73 147 17.07 33.10 148 117.07 33.00 149 -117.07 32.89 150 33.73 151 -116.23 33.71 152 116.16 43.66 153 -115.34 6.15 154 -115.26 36.18 155 -115.21 36.15 156 -115.05 36.06 157 12.47 34.54 158 -112.46 33.66 159 112.26 33.64 160 -112.10 33.86 161 -112.06 33.58 162 1 12.03 33.51 163 111.99 33.44 164 111.98 33.58 165 11.96 33.54 166 111.90 33.38 167 11.89 33.62 168 111.79 33.31 169 110.97 32.39 170 110.94 32.25 171 -110.89 32.25 172 106.57 35.10 173 106.52 35.18 174 -105.85 35.62 175 -104.98 39.73 176 -104.95 39.61 177 04.76 38.90 178 98.45 29.49 179 -98.41 29.40 180 -97.76 30.44 181 -97.75 30.40 182 -97.74 30.27 183 -97.38 32.74 184 -97.38 32.71 185 97.13 32.94 186 -96.95 32.63 187 96.79 32.90 18 8 96.76 32.78 189 -96.65 40.74 190 -96.50 32.83 191 -96.05 41.27 192 .95.88 36 .18 193 95.78 29.74 + 194 -95.63 29.90 195 -95.58 29.74 196 -95.51 30 .17 197 -95.49 29.75 198 -94.84 39.04 199 -93.46 45.07 Data : 30.99801356 Sum: 6137.606685 ReadyQ Search Sheet "+ Share 3 TraderJoes XLSTAT Cloud StatPlus Data Mining AutoSum . Insert Draw Page Layout Formulas Data Review View Good Neutral Calculation Fill Home Bad Wrap Text General Normal Insert e Format Sort & Find & Note Clear Select Cut Times New.. . 12 . A- A Check Cell Explanatory T... Input Linked Cell Conditional Format Copy Merge & Center $ ~ % 2 08 420 Formatting as Table AJ AK AL AM Paste BI US. A. AA AB AC AD AE AF AG AH Al Format W A201 fx 200 200 -93.43 44.90 201 .93.34 44.95 202 -93.16 44.93 203 -93.15 45.08 204 -92.95 44.92 205 91.14 30.42 206 90.75 41.92 207 -90.58 38.66 208 -90.43 38.60 209 -88.34 41.86 210 -88.29 42.17 211 88.14 41.76 212 -88.04 42.05 213 88.02 41.81 214 -88.01 41.86 215 87.98 42.11 216 -87.95 42.28 217 -87.84 42.01 218 -87.83 42.01 219 -87.83 42.13 220 -87.83 41.63 221 -87.82 42.07 222 -87.80 41.89 223 -87.66 41.90 224 -87.64 41.93 225 .87.62 41.87 226 86.73 33.45 227 -86.22 41.74 228 -86.21 39.91 229 -86.08 39.91 230 .85.65 38.26 231 -85.63 38.25 232 -85.58 42.91 233 -84.59 42.69 234 -84.53 38.01 235 .84.50 33.86 236 .84.40 39.21 237 84.39 33.93 238 -84.37 33.77 239 -84.28 30.44 240 -84.24 33.99 241 -84, 16 39.85 242 84.15 39.68 243 -84.01 35.91 244 -83.48 42.43 245 .83.13 42.49 246 83.11 40.10 247 -83.11 42.70 248 -82.92 40.04 249 82.63 27.79 250 -82.51 27.26 251 -82.51 27.94 252 -82.37 29.62 253 -82.33 34 . 81 254 -82.27 28 . 33 255 81.92 41.46 256 -81.81 26.24 257 -81.48 41.46 258 81.46 28 .46 259 -81.41 30.27 260 -81.37 28.60 261 80.85 35.16 262 -80.29 26.03 263 -80.29 25 .66 264 -80.24 26.64 265 -80.12 26.15 $1.48103451 Count: 198 266 -80.09 26.86 Data ReadyQ Search Sheet 3 TraderJoes "+ Share StatPlus Data Mining AutoSum . Home Insert Draw Page Layout Formulas Data Review View XLSTAT Cloud Bad Good Neutral Calculation Fill Cut Times New... . 12 . A- A Wrap Text General Normal Linked Cell Note Insert e Format Find & Clear Sort & Conditional Format Check Cell Explanatory T.. Input Select Copy Paste B I US. A. Merge & Center $ % 2 08 420 Formatting as Table Format AM AA AB AC AD AE AF AG AH Al AJ AK AL A267 fx 266 W 266 -80.09 26.86 267 80.08 26.55 268 80.06 26.47 269 80.02 40.56 270 -79.85 32.82 271 -79.09 40.36 272 -79.00 35.93 273 78.78 43.04 274 -78.47 38.08 275 -77.86 40.79 276 -77.59 43.09 277 -77.51 37.67 278 77.43 38.84 279 77.35 38.98 280 -77.19 38.77 281 -77.13 38.85 282 -77.07 38.99 283 -77 05 38.80 284 77.02 38.90 285 -77.00 39.02 286 -76.80 39.19 287 76.74 39.39 288 -76.54 37.11 289 76.08 43.04 290 -76.05 36.87 291 -75.43 40.07 292 -75.29 40.01 293 -75.25 40.23 294 -74.92 39.89 295 -74.61 40.35 296 -74.39 40.79 297 -74.30 40.73 298 -74.15 40.84 299 -74.08 40. 94 300 -74.03 40.99 301 -74.00 40.72 302 -73.99 40.73 303 -73.99 40.70 304 73.98 40.74 305 -73.98 40.78 306 -73.98 40.83 307 -73.83 42.72 308 -73.80 41.02 309 -73.75 40.77 310 -73.70 40.64 311 -73.64 40.64 312 73.58 40.75 313 -73.47 40.78 314 -73.46 41.08 315 -73.43 41.21 316 -73.36 41.13 317 -73.31 40.84 318 73.25 41.19 319 73.12 40.85 320 -72.73 41.74 321 -72.59 42.34 322 -71.71 42.30 323 -71.55 32.93 324 71.45 42.32 325 -71.41 42.48 326 -71.23 42.29 327 71.20 42.50 328 -71.12 42.34 329 -71.10 42.36 330 -70.94 42.46 331 -70.93 42.53 332 -70.29 41.65 e: 87.39288783 Count: 198 Data + ReadyQ Search Sheet 3 TraderJoes "+ Share Home Insert Draw Page Layout Formulas Data Review View XLSTAT Cloud StatPlus Data Mining AutoSum . Cut Times New.. . 12 . A- A Wrap Text General Normal Bad Good Neutral Calculation Fill Copy Merge & Center $ % 2 08 420 Conditional Format Check Cell Explanatory T... Input Linked Cell Note Insert e Format Sort & Find & Select Paste Format BI U. .SA. Clear Formatting as Table A333 fx 332 AA AB AC AD AE AF AG AH Al AJ AK AL AM W 296 74.39 40.79 297 74.30 40.73 298 -74. 15 40-84 299 -74.08 40.94 300 -74-03 40.99 301 -74.00 40.72 302 -73.99 40.73 303 -73.99 40.70 304 -73.98 40.74 305 73.98 40.78 306 -73.98 40.83 307 -73.83 42.72 308 -73.80 41.02 309 -73.75 40.77 310 73.70 40.64 311 -73.64 40.64 312 -73.58 40.75 313 -73.47 40.78 314 -73.46 41.08 315 -73.43 41.21 316 73.36 41.13 317 -73.31 40.84 318 -73.25 41.19 319 -73.12 40.85 320 -72.73 41.74 321 -72.59 42.34 322 -71.71 42.30 323 -71.55 -32.93 324 71.45 42.32 325 71.41 42.48 326 -71.23 42.29 327 71.20 42.50 328 -71.12 42.34 329 -71.10 42.36 330 -70.94 42.46 331 -70.93 42.53 332 -70.29 41.65 333 -70.26 43.66 334 50.12 26.46 Data + Average: 113.3724491 Count: 9 Sum: 1020.352042 ReadyWord File Edit View Insert Format Tools Table Window Help ON ) Sun 8:10 PM Q Week 9 HW replace Q v Search in Document . M Ren x | Mic x | Top x | Jen x 2 Min x C Get x C Its x K-n x * Col x * 233 x $ SAS X $ SAS X Home Insert Dr Draw Design References Mailings Review View Z Zotero RCM Grammarly "+ Share ~ Outline Ruler One Page C D @ coursehero.com/qa/attachment/23335256/?_chid=448e0c61-e54a-4d4e-a284-a13f1605fefa Gridlines Multiple Pages Print Web Draft Focus Immersive Switch Zoom Zoom Arrange Split Macros Layout Layout Reader Modes Navigation Pane to 100% Page Width Window All Windows MATH601 Week 9 Homework Replacement (1.25 points per problem; total of 10 points) provide TraderJoes, GroceryStoreStacked, FBS, and DemoKTC data sets) . Josephine Mater works for the supply-chain analytics division of Trader Joe's, a national chain of specialty grocery stores. Trader Joe's is considering a redesign of its supply chain. Josephine knows that Trader Joe's uses frequent truck shipments from its distribution centers to its retail stores. The file TraderJoes contains data on the location of Trader Joe's retail stores. To keep costs lost, retail stores are typically located near a distribution center. Normalize the values of the input variables to adjust for the different magnitudes of the variables. Josephine would like to es. Josephine would like to use k-means clustering to estimate the location and number of Trader Joe's distribution centers (; distribution centers (information on Trader Joe's distribution centers is not publicly disclosed). (A) Normalize the data and put in 8 for the number of clusters and maximum number of iterations at 10. Answer should list the frequency in each cluster. Cluster Number Frequency B): Provide the answers to the paragraph at the bottom, underlining or highlighting in some way, the words you are choosing. (B): Provide the answers to the paragraph at the bottom, underlining or highlighting in some way, the words you are choosing. According to the solution, between. and retail stores would be assigned to each According to the solution, between _ _ and _ retail stores would be assigned to each distribution center. It (would be / would not be) very unusual to assign a distribution center to a distribution center. It (would be / would not be) very unusual to assign a distribution center to a single store. It would also (unlikely / lik "runningely / likely) result in distribution centers with very different sizes. This type of solution approach (does / does not) consider the amount of material being supplied to single store. It would also (unlikely / likely) result in distribution centers with very different sizes. each retail store from the distribution center. This type of solution approach (does / does not) consider the amount of material being supplied to leach retail store from the distribution center. 2. In an effort to inform political leaders and economists discussing the deregulation of electric and gas utilities, data on eight numerical variables from utility companies have been grouped using hierarchical clustering based on Euclidean distance as the similarity measure and complete linkage as the clustering method. (A): Based on the following dendrogram, what is the most appropriate number of clusters or organize these utility companies? MATH_601_Projepdf Show All Page 1 of 6 249 of 1806 words & English (United States) Focus = = - 118% OCT 17
Step by Step Solution
There are 3 Steps involved in it
Step: 1
Get Instant Access to Expert-Tailored Solutions
See step-by-step solutions with expert insights and AI powered tools for academic success
Step: 2
Step: 3
Ace Your Homework with AI
Get the answers you need in no time with our AI-driven, step-by-step assistance