

Question: 3. Use your option pricer to fill in the table and create a graph of the volatility smile for the closing prices for TSLA
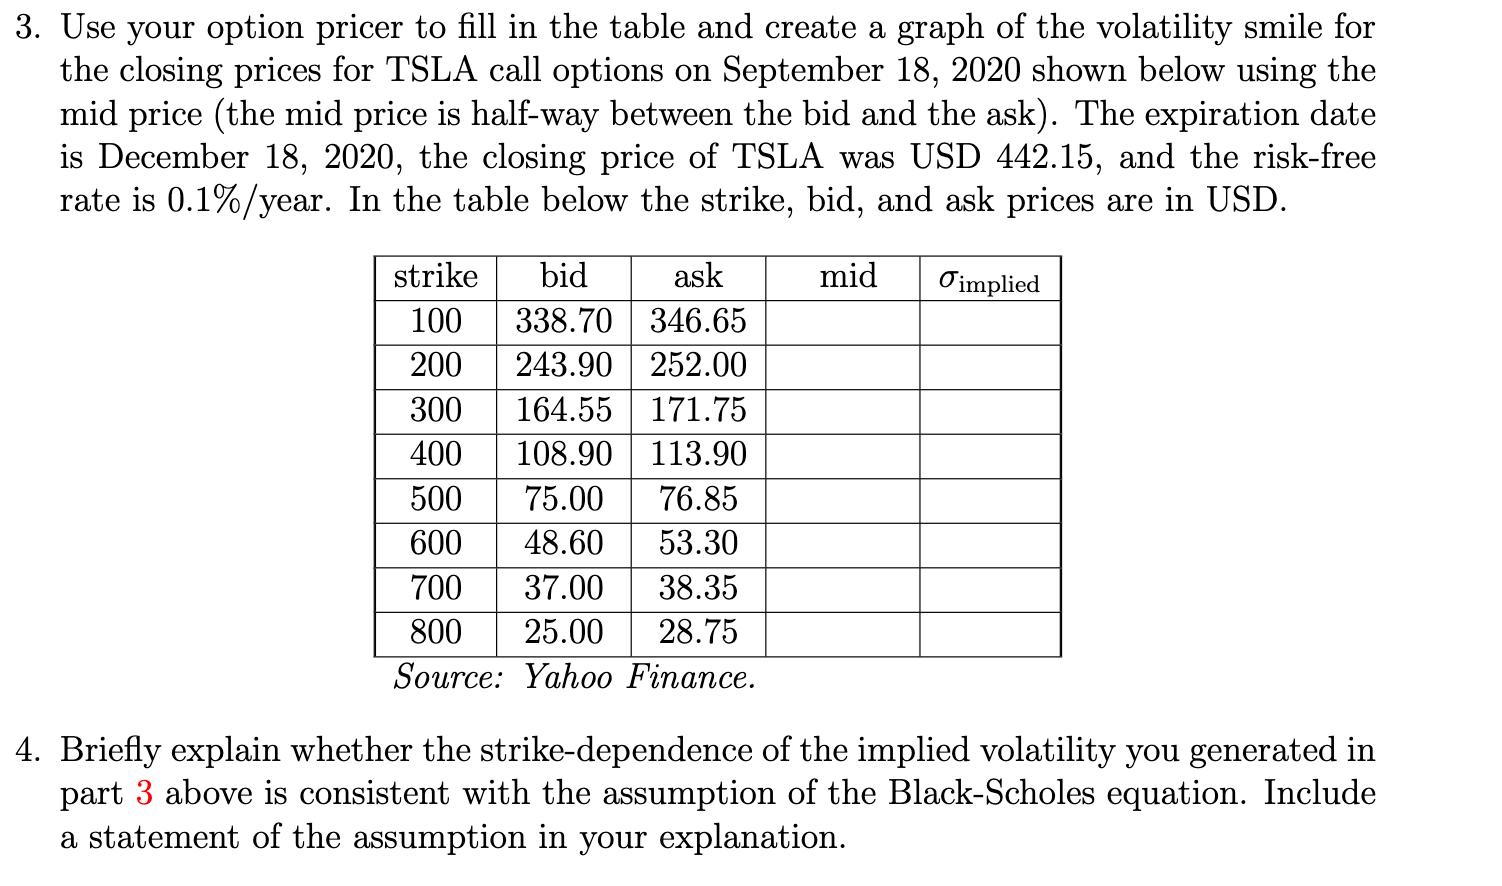
3. Use your option pricer to fill in the table and create a graph of the volatility smile for the closing prices for TSLA call options on September 18, 2020 shown below using the mid price (the mid price is half-way between the bid and the ask). The expiration date is December 18, 2020, the closing price of TSLA was USD 442.15, and the risk-free rate is 0.1%/year. In the table below the strike, bid, and ask prices are in USD. strike bid ask mid Oimplied 100 338.70 346.65 200 243.90 252.00 300 164.55 171.75 400 108.90 113.90 500 75.00 76.85 600 48.60 53.30 700 37.00 38.35 800 25.00 28.75 Source: Yaho0 Finance. 4. Briefly explain whether the strike-dependence of the implied volatility you generated in part 3 above is consistent with the assumption of the Black-Scholes equation. Include a statement of the assumption in your explanation.
Step by Step Solution
3.44 Rating (154 Votes )
There are 3 Steps involved in it
Utilizing Excel Goal Seek The Goal Seek function in Excel does just the same thing except the machin... View full answer

Get step-by-step solutions from verified subject matter experts