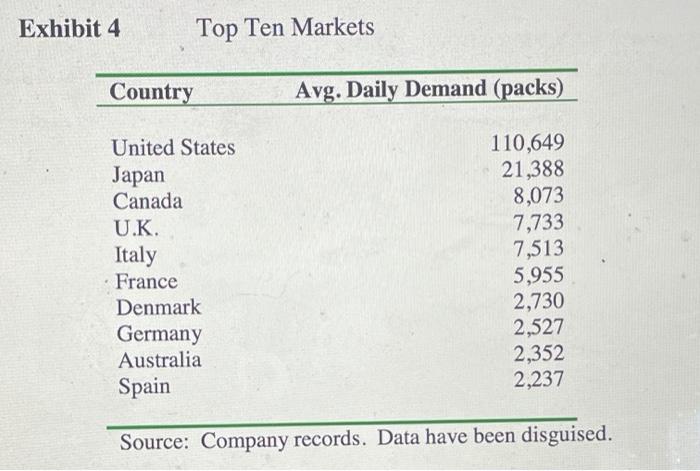
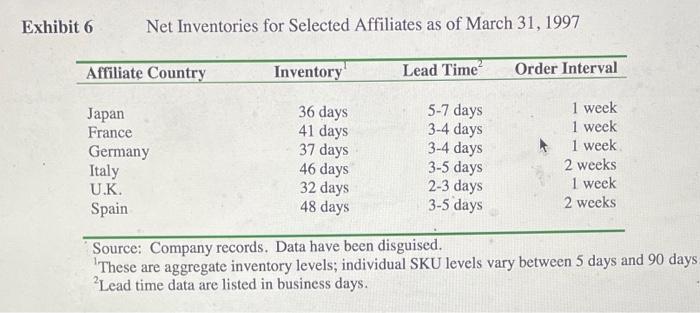
3) Using the data from Exhibits 4 and 6 quantitatively evaluate the potential impact of the pilot plan (see p.6) of centralized distribution for European affiliates (i.e. UK, Italy, France, Denmark, Germany, and Spain). Assume that the standard deviation of daily demand is 50% of the average daily demand. Note that the data for Denmark is missing in Exhibit 6. So assume that the lead time is 5 days and the order interval is 2 weeks for Denmark. Please show the details of all calculations. [14 pts) Exhibit 4 Top Ten Markets Country Avg. Daily Demand (packs) United States Japan Canada U.K. Italy France Denmark Germany Australia Spain 110,649 21,388 8,073 7,733 7,513 5,955 2,730 2,527 2,352 2,237 Source: Company records. Data have been disguised. Exhibit 6 Net Inventories for Selected Affiliates as of March 31, 1997 Affiliate Country Inventory Lead Time Order Interval Japan France Germany Italy UK Spain 36 days 41 days 37 days 46 days 32 days 48 days 5-7 days 3-4 days 3-4 days 3-5 days 2-3 days 3-5 days 1 week 1 week 1 week 2 weeks 1 week 2 weeks Source: Company records. Data have been disguised. These are aggregate inventory levels, individual SKU levels vary between 5 days and 90 days 2 Lead time data are listed in business days. 3) Using the data from Exhibits 4 and 6 quantitatively evaluate the potential impact of the pilot plan (see p.6) of centralized distribution for European affiliates (i.e. UK, Italy, France, Denmark, Germany, and Spain). Assume that the standard deviation of daily demand is 50% of the average daily demand. Note that the data for Denmark is missing in Exhibit 6. So assume that the lead time is 5 days and the order interval is 2 weeks for Denmark. Please show the details of all calculations. [14 pts) Exhibit 4 Top Ten Markets Country Avg. Daily Demand (packs) United States Japan Canada U.K. Italy France Denmark Germany Australia Spain 110,649 21,388 8,073 7,733 7,513 5,955 2,730 2,527 2,352 2,237 Source: Company records. Data have been disguised. Exhibit 6 Net Inventories for Selected Affiliates as of March 31, 1997 Affiliate Country Inventory Lead Time Order Interval Japan France Germany Italy UK Spain 36 days 41 days 37 days 46 days 32 days 48 days 5-7 days 3-4 days 3-4 days 3-5 days 2-3 days 3-5 days 1 week 1 week 1 week 2 weeks 1 week 2 weeks Source: Company records. Data have been disguised. These are aggregate inventory levels, individual SKU levels vary between 5 days and 90 days 2 Lead time data are listed in business days


