Answered step by step
Verified Expert Solution
Link Copied!

Question

1 Approved Answer

3. Using the following gas well pressure test data; a. Determine (plot) the stabilized deliverability curve and calculate the constants C and n. b. Calculate
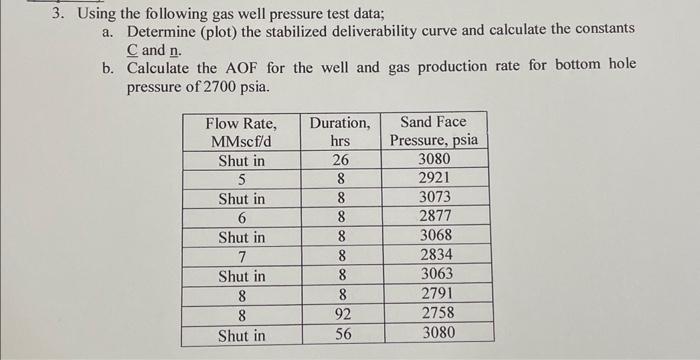
image text in transcribed
3. Using the following gas well pressure test data; a. Determine (plot) the stabilized deliverability curve and calculate the constants C and n. b. Calculate the AOF for the well and gas production rate for bottom hole pressure of 2700psia. 3. Using the following gas well pressure test data; a. Determine (plot) the stabilized deliverability curve and calculate the constants C and n. b. Calculate the AOF for the well and gas production rate for bottom hole pressure of 2700psia

Step by Step Solution

There are 3 Steps involved in it

Step: 1

blur-text-image

Get Instant Access to Expert-Tailored Solutions

See step-by-step solutions with expert insights and AI powered tools for academic success

Step: 2

blur-text-image

Step: 3

blur-text-image

Ace Your Homework with AI

Get the answers you need in no time with our AI-driven, step-by-step assistance

Get Started

Recommended Textbook for

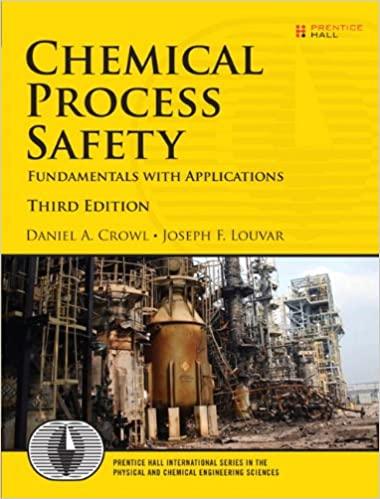
Chemical Process Safety Fundamentals With Applications

Authors: Daniel A. Crowl, Joseph F. Louvar

3rd Edition

0131382268, 978-0131382268

More Books

Students also viewed these Chemical Engineering questions

Question

13. Place the results of this analysis in the out files directory.

Answered: 1 week ago