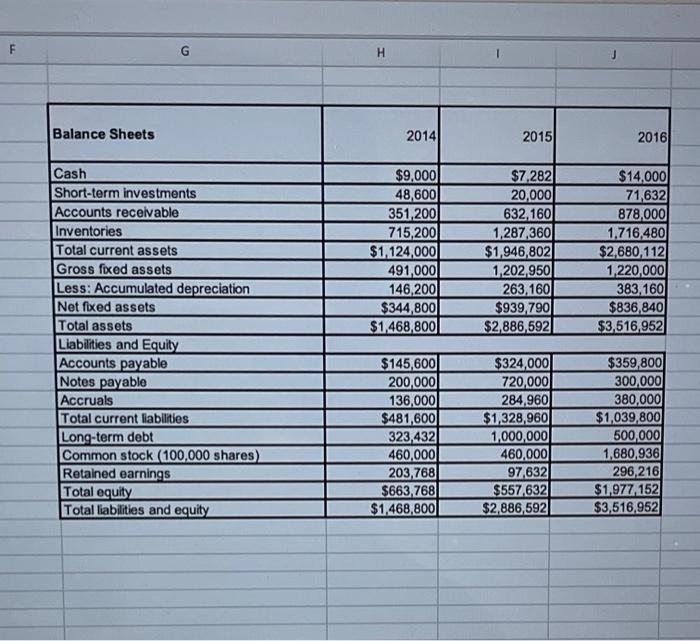
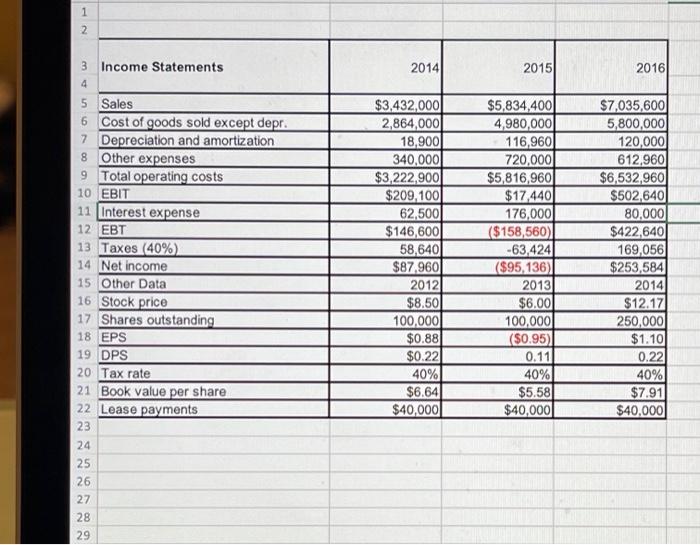
3. Using the following information, please calculate free cash flow in Excel for years 2015 and 2016. F G H Balance Sheets 2014 2015 2016 $9,000 48,600 351,200 715,200 $1,124,000 491,000 146,200 $344,800 $1,468,8001 $7.282 20,000 632,160 1,287,360 $1,946,802 1,202,950 263,160 $939,790 $2,886,592 $14.000 71,632 878,000 1,716,4801 $2,680,112 1,220,000 383,160 $836,840 $3,516,952 Cash Short-term investments Accounts receivable Inventories Total current assets Gross fixed assets Less: Accumulated depreciation Net fixed assets Total assets Liabilities and Equity Accounts payable Notes payable Accruals Total current liabilities Lor rm debt Common stock (100,000 shares) Retained earnings Total equity Total liabilities and equity $145,600 200,000 136,000 $481,600 323,432 460,0001 203,768 $663 768 $1,468,800 $324,000 720,000 284,960 $1,328,960 1,000,000 460,000 97,632 $557,632 $2.886,592 $359,800 300,000 380,000 $1,039,800 500,000 1,680,936 296,216 $1,977 152 $3,516,952 1 2 2014 2015 2016 3 Income Statements 4 5 Sales 6 Cost of goods sold except depr. 7 Depreciation and amortization 8 Other expenses 9 Total operating costs 10 EBIT 11 Interest expense 12 EBT 13 Taxes (40%) 14 Net income 15 Other Data 16 Stock price 17 Shares outstanding 18 EPS 19 DPS 20 Tax rate 21 Book value per share 22 Lease payments 23 24 25 26 27 28 29 $3,432,000 2,864,000 18,9001 340,000 $3,222,900 $209,100 62,500 $146,6001 58,640 $87,9601 2012 $8.50 100,000 $0.88 $0.22 40% $6.64 $40,000 $5,834,400 4,980,000 116,960 720,000 $5,816,960 $17.440 176,000 ($158,560) -63.424 ($95,136) 2013 $6.00 100,000 ($0.95) 0.11 40% $5.58 $40,000 $7,035,600 5,800,000 120,000 612,960 $6,532,960 $502,640) 80,000 $422,640 169,056 $253,584 2014 $12.17 250,000 $1.10 0.22 40% $7.91 $40,000 NNNNN