Answered step by step
Verified Expert Solution
Question
1 Approved Answer
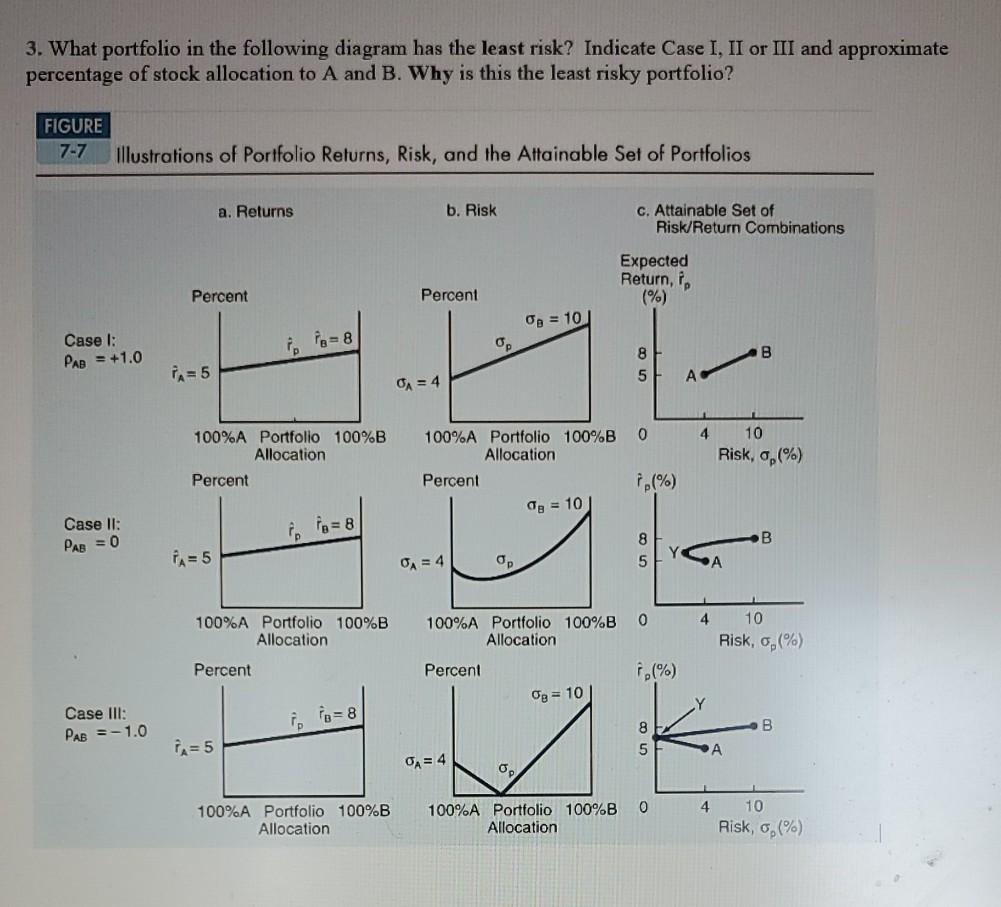
3. What portfolio in the following diagram has the least risk? Indicate Case I, II or III and approximate percentage of stock allocation to A

3. What portfolio in the following diagram has the least risk? Indicate Case I, II or III and approximate percentage of stock allocation to A and B. Why is this the least risky portfolio? FIGURE 7-7 Illustrations of Portfolio Returns, Risk, and the Attainable Set of Portfolios a. Returns b. Risk c. Attainable Set of Risk/Return Combinations Expected Return, Percent Percent (%) 0 = 10 Case I: Pap = +1.0 B p=5 8 5 = 4 0 4 100%A Portfolio 100%B Allocation Percent 10 Risk, 0,(%) 100%A Portfolio 100%B Allocation Percent Og = 10 P (%) Case II: B PAB = 0 A=5 8 5 Y 0A = 4 0. 0 4 100%A Portfolio 100%B Allocation 100%A Portfolio 100%B Allocation 10 Risk, 0,1% Percent Percent 16(%) Op = 10 Case III: B PAB = -1.0 PA=5 8 5 A A= 4 0. 0 4 10 100%A Portfolio 100%B Allocation 100%A Portfolio 100%B Allocation Risk, 6,(%)
Step by Step Solution
There are 3 Steps involved in it
Step: 1

Get Instant Access to Expert-Tailored Solutions
See step-by-step solutions with expert insights and AI powered tools for academic success
Step: 2

Step: 3

Ace Your Homework with AI
Get the answers you need in no time with our AI-driven, step-by-step assistance
Get Started


