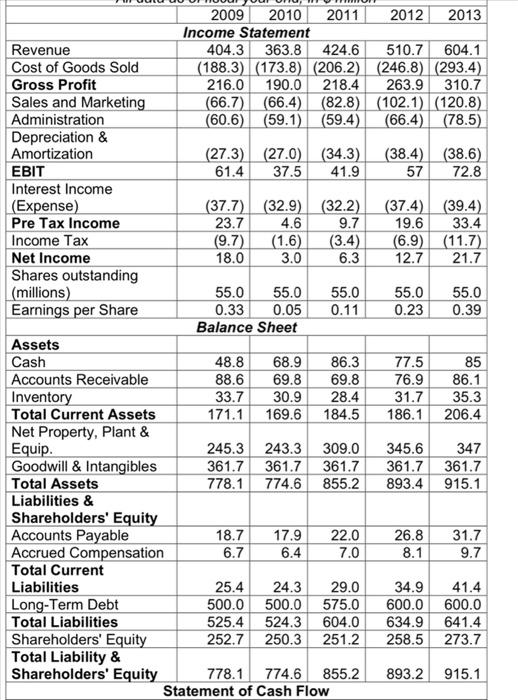
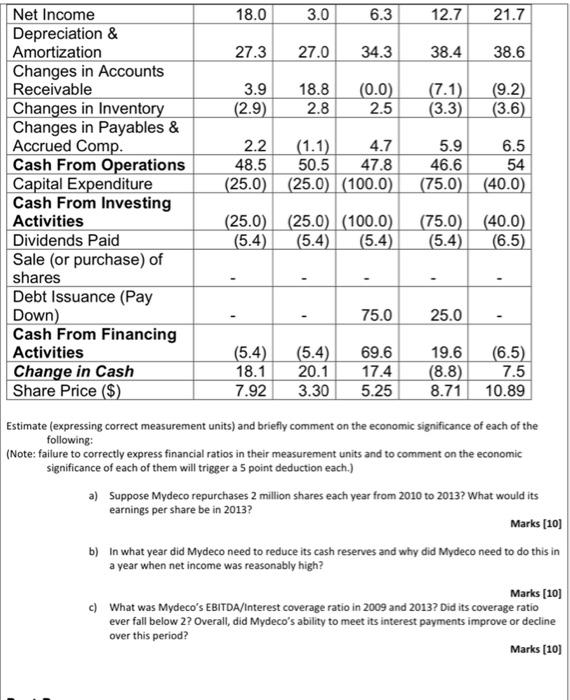
3.0 2009 2010 2011 2012 2013 Income Statement Revenue 404.3 363.8 424.6 510.7 604.1 Cost of Goods Sold (188.3) (173.8) (206.2) (246.8) (293.4) Gross Profit 216.0 190.0 218.4 263.9 310.7 Sales and Marketing (66.7) (66.4) (82.8) (102.1) (120.8) Administration (60.6) (59.1) (59.4) (66.4) (78.5) Depreciation & Amortization (27.3) (27.0) (34.3) (38.4) (38.6) EBIT 61.4 37.5 41.9 57 72.8 Interest Income (Expense) (37.7) (32.9) (32.2) (37.4) (39.4) Pre Tax Income 23.7 4.6 9.7 19.6 33.4 Income Tax (9.7) (1.6) (3.4) (6.9) (11.7) Net Income 18.0 6.3 12.7 21.7 Shares outstanding (millions) 55.0 55.0 55.0 55.0 55.0 Earnings per Share 0.33 0.05 0.11 0.23 0.39 Balance Sheet Assets Cash 48.8 68.9 86.3 77.5 85 Accounts Receivable 88.6 69.8 69.8 76.9 86.1 Inventory 33.7 30.9 28.4 31.7 35.3 Total Current Assets 171.1 169.6 184.5 186.1 206.4 Net Property, Plant & Equip. 245.3 243.3 309.0 345.6 347 Goodwill & Intangibles 361.7 361.7 361.7 361.7 361.7 Total Assets 778.1 774.6 855.2 893.4 915.1 Liabilities & Shareholders' Equity Accounts Payable 18.7 17.9 22.0 26.8 31.7 Accrued Compensation 6.7 6.4 7.0 8.1 9.7 Total Current Liabilities 25.4 24.3 29.0 34.9 41.4 Long-Term Debt 500.0 500.0 575.0 600.0 600.0 Total Liabilities 525.4 524.3 604.0 634.9 641.4 Shareholders' Equity 252.7 250.3 251.2 258.5 273.7 Total Liability & Shareholders' Equity 778.1 774.6 855.2 893.2 915.1 Statement of Cash Flow 18.0 3.0 6.3 12.7 21.7 27.3 27.0 34.3 38.4 38.6 18.8 3.9 (2.9) (0.0) 2.5 (7.1). (3.3) 2.8 (9.2) (3.6) 2.2 (1.1) 4.7 48.5 50.5 47.8 (25.0) (25.0) (100.0) 5.9 6.5 46.6 54 (75.0) (40.0) Net Income Depreciation & Amortization Changes in Accounts Receivable Changes in Inventory Changes in Payables & Accrued Comp. Cash From Operations Capital Expenditure Cash From Investing Activities Dividends Paid Sale (or purchase) of shares Debt Issuance (Pay Down) Cash From Financing Activities Change in Cash Share Price ($) (25.0) (25.0) (100.0) (5.4) (5.4 (75.0) (40.0) (5.4) (6.5) (5.4) 75.0 25.0 ! (5.4) 18.1 7.92 (5.4) 20.1 3.30 69.6 17.4 5.25 19.6 (6.5) (8.8) 7.5 8.71 10.89 Estimate (expressing correct measurement units) and briefly comment on the economic significance of each of the following: (Note: failure to correctly express financial ratios in their measurement units and to comment on the economic significance of each of them will trigger a 5 point deduction each.) a) Suppose Mydeco repurchases 2 million shares each year from 2010 to 2013? What would its earnings per share be in 2013? Marks (10) b) In what year did Mydeco need to reduce its cash reserves and why did Mydeco need to do this in a year when net income was reasonably high? Marks (10) c) What was Mydeco's EBITDA/Interest coverage ratio in 2009 and 2013? Did its coverage ratio ever fall below 2? Overall, did Mydeco's ability to meet its interest payments improve or decline over this period? Marks


