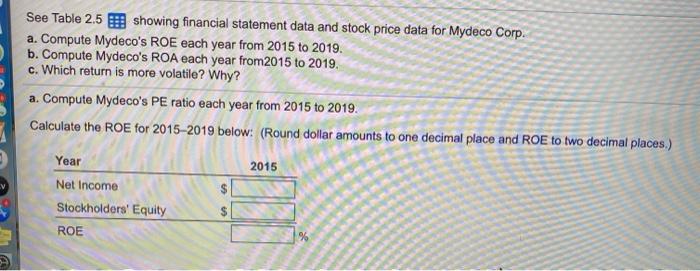
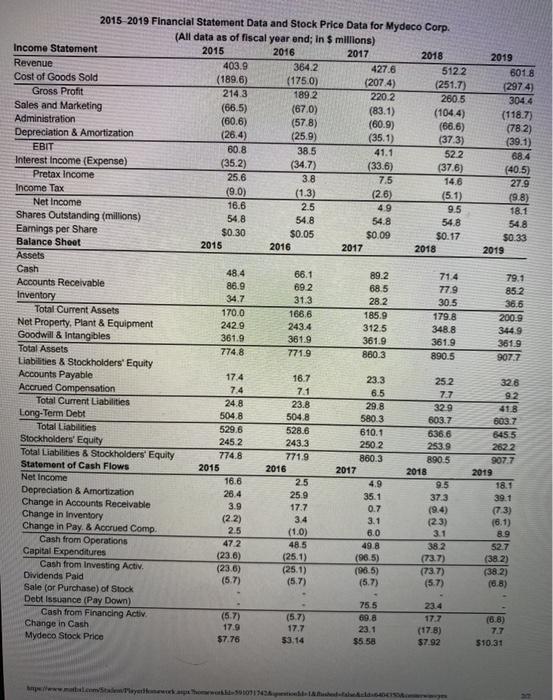
See Table 2.5 E showing financial statement data and stock price data for Mydeco Corp. a. Compute Mydeco's ROE each year from 2015 to 2019. b. Compute Mydeco's ROA each year from 2015 to 2019, c. Which return is more volatile? Why? a. Compute Mydeco's PE ratio each year from 2015 to 2019. Calculate the ROE for 2015-2019 below: (Round dollar amounts to one decimal place and ROE to two decimal places.) 2015 Year Net Income Stockholders' Equity ROE 427.6 2019 6018 (2974) 304.4 (118.7) (782) (39.1) 68.4 (40.5) 27.9 (9.8) 18.1 54.8 $0.33 2019 54.8 2015-2019 Financial Statement Data and Stock Price Data for Mydeco Corp. (All data as of fiscal year end; in $ millions) Income Statement 2015 2016 2017 2018 Revenue 403.9 364.2 5122 Cost of Goods Sold (189.6) (175.0) (2074) (251.7) Gross Profit 2143 1892 220.2 2605 Sales and Marketing (66.5) (67.0) (83.1) (104.4) Administration (60.6) (578) (60.9) (66.6) Depreciation & Amortization (26.4) (25.9) (35.1) (373) EBIT 60.8 38.5 41.1 522 Interest Income (Expense) (35.2) (34.7) (33.6) (37.6) Pretax Income 25.6 3.8 7.5 14.6 Income Tax (9.0) (1.3) (26) (5.1) Net Income 16.6 2.5 49 9.5 Shares Outstanding (millions) 54.8 54.8 54.8 Earnings per Share $0.30 $0.05 $0.09 $0.17 Balance Sheet 2015 2016 2017 2018 Assets Cash 48.4 66.1 89.2 71.4 Accounts Receivable 86.9 692 68.5 779 Inventory 34.7 31.3 28.2 30.5 Total Current Assets 170.0 168,6 185.9 179.8 Net Property, Plant & Equipment 242.9 243.4 3125 348.8 Goodwill & Intangibles 361.9 361.9 361.9 361.9 Total Assets 774.8 771.9 860.3 890.5 Liabilities & Stockholders' Equity Accounts Payable 17.4 18.7 23.3 25.2 Accrued Compensation 7.4 7.1 6.5 7.7 Total Current Liabilities 24.8 23.8 29.8 329 Long-Term Debt 504.8 504.8 580.3 603.7 Total Liabilities 529.6 528.6 810.1 636.6 Stockholders' Equity 245 2 243.3 2502 253.9 Total Liabilities & Stockholders' Equity 774.8 771.9 860.3 890.5 Statement of Cash Flows 2015 2016 2017 2018 Net Income 16.6 25 9.5 Depreciation & Amortization 26.4 25.9 373 Change in Accounts Receivable 3.9 17.7 0.7 (9.4) Change in Inventory (2.2) 3.4 3.1 (23) Change in Pay & Accrued Comp. 2.5 (1.0) 6.0 3.1 Cash from Operations 472 48.5 49.8 38.2 Capital Expenditures (236) (25.1) (96.5) (73.7) Cash from Investing Activ (236) (25.1) (965) (737) Dividends Paid (5.7) (5.7) (5.7) (57) Sale (or Purchase) of Stock Debt Issuance (Pay Down) 75.5 23.4 Cash from Financing Activ (5.7) (57) 698 17.7 Change in Cash 17.9 17.7 23.1 (17.8) Mydeco Stock Price $7.76 33.14 $5 58 $7.92 79.1 852 36.6 200.9 344.9 3619 907.7 4.9 32.6 92 418 603.7 645 5 2622 907.7 2019 18.1 39.1 (73) (6.1) 8.9 52.7 (382) (38.2) (0.8) 35.1 (6.8) 747 $10.31