Answered step by step
Verified Expert Solution
Question
1 Approved Answer
3.00 points Problem 13-1A Calculation and analysis of trend percents LO A1, P1 Selected comparative financial statements of Haroun Company follow HAROUN COMPANY Comparative Income
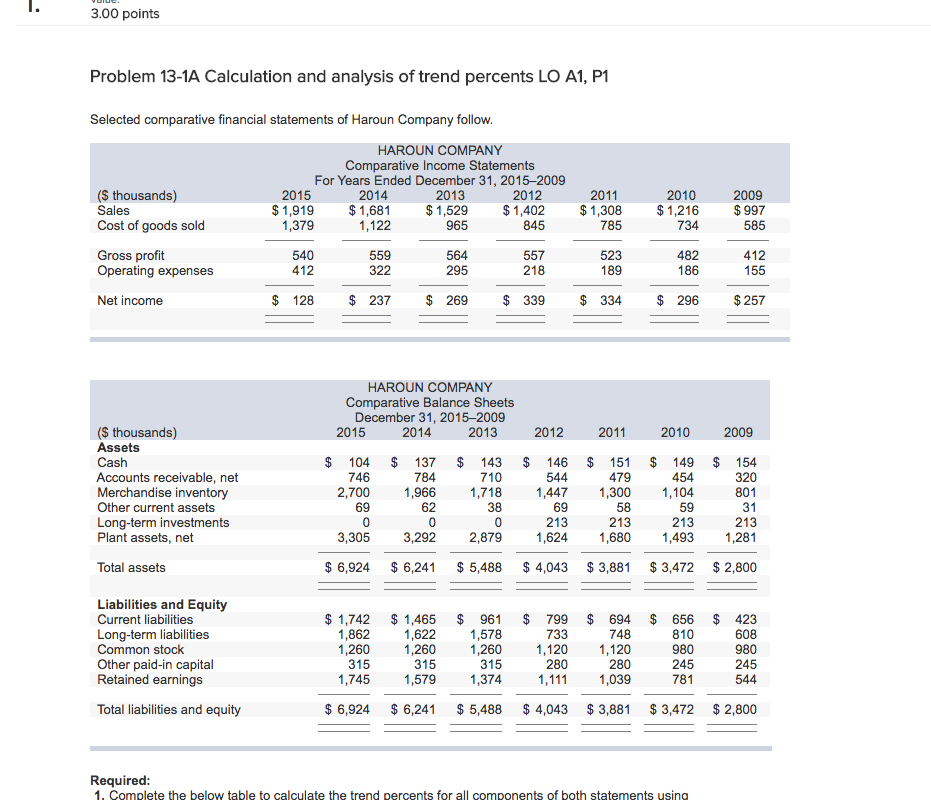
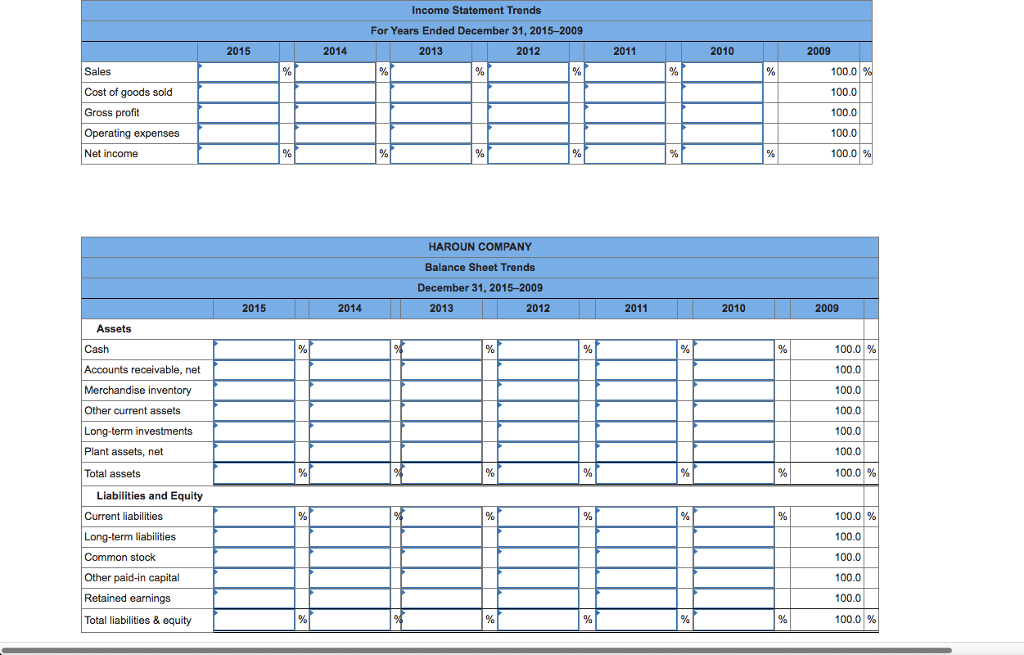
3.00 points Problem 13-1A Calculation and analysis of trend percents LO A1, P1 Selected comparative financial statements of Haroun Company follow HAROUN COMPANY Comparative Income Statements For Years Ended December 31, 2015-2009 2014 $1,919$1,681 1,122 2012 845 557 2010 (S thousands) Sales 2015 1,379 540 2009 $ 1,529 $1,402 1,308 $1,216 $997 585 2013 965 564 2011 785 523 Cost of goods sold Gross profit Operating expenses 559 322 482 186 295 189 Net income $ 128 237 $ 269 $ 339 334 296 $257 HAROUN COMPANY Comparative Balance Sheets December 31, 2015-2009 2013 2011 2009 (S thousands) Assets 2015 2014 2012 2010 151 $ 149 454 1,447,300 1,104 154 320 801 $ 104 $ 137$ 143 $ 146 Accounts receivable, net Merchandise inventory Other current assets Long-term investments Plant assets, net 784 1,966 479 746 2,700 1,718 38 0 58 0 0 3,305 3,292 2,879 1,624 1,680 1,493 1,28 Total assets $ 6,924 6,241 $ 5,488 $4,043 $3,881 $ 3,472 $ 2,800 Liabilities and Equity Current liabilities Long-term liabilities Common stock Other paid-in capital Retained earnings $1,742 $1,465 $ 961 $ 799 $ 694 $ 656 $ 423 608 980 245 544 1,862 1,622 1,578 748 1,260 1,260 1,260 ,120 1,120 280 1,1111,039 733 980 245 781 280 1,745 1,579 1,374 Total liabilities and equity $ 6,924$ 6,241 $ 5,488 $4,043 $3,881 $ 3,472 $ 2,800 Required 1. Complete the below table to calculate the trend percents for all components of both statements using
Step by Step Solution
There are 3 Steps involved in it
Step: 1
Get Instant Access to Expert-Tailored Solutions
See step-by-step solutions with expert insights and AI powered tools for academic success
Step: 2
Step: 3
Ace Your Homework with AI
Get the answers you need in no time with our AI-driven, step-by-step assistance
Get Started