3.06 7 84% The mode score on the math 152 test 1 point of UPang students was 94! Which of these interpretations must be correct?
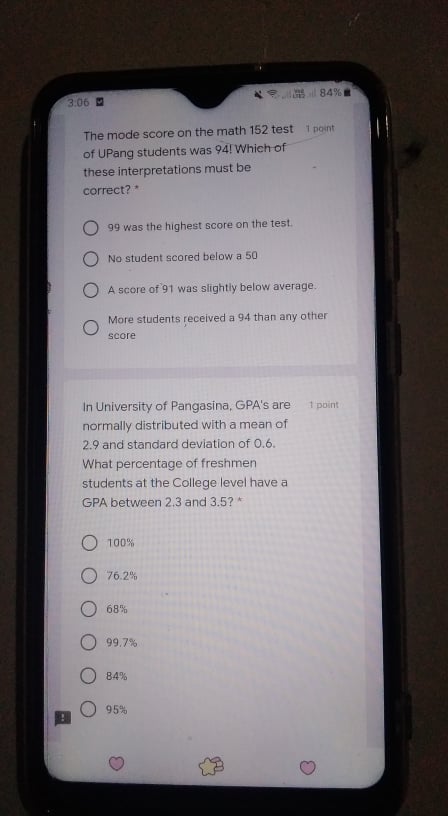
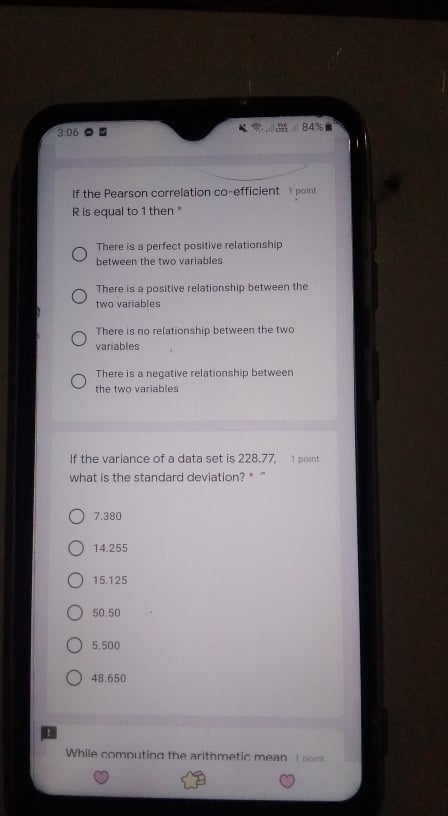
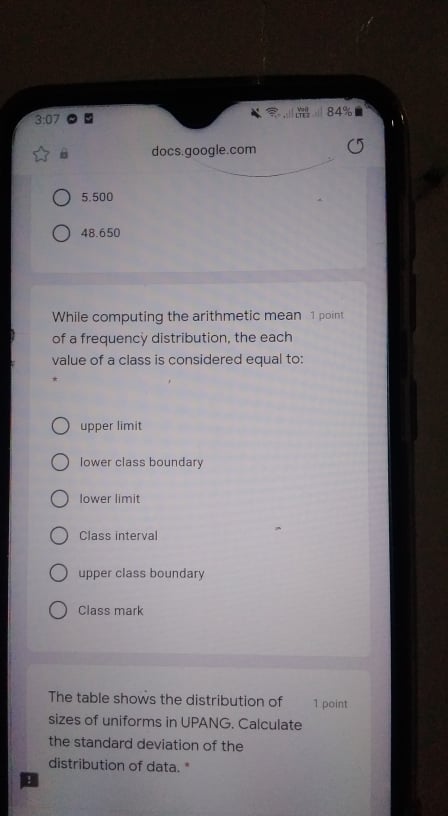
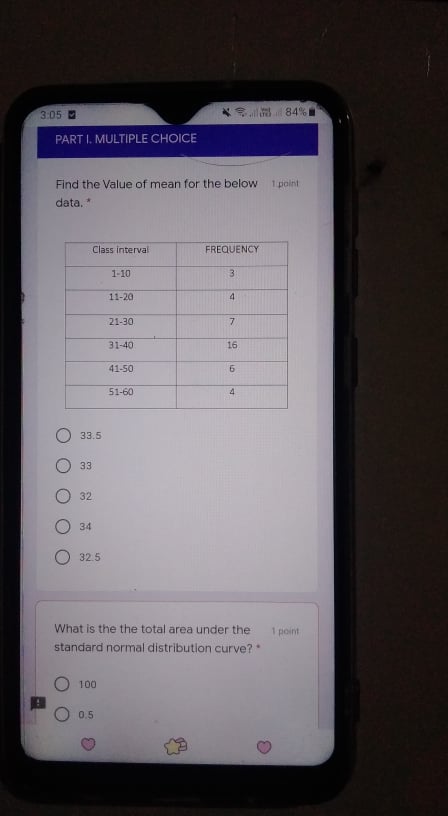
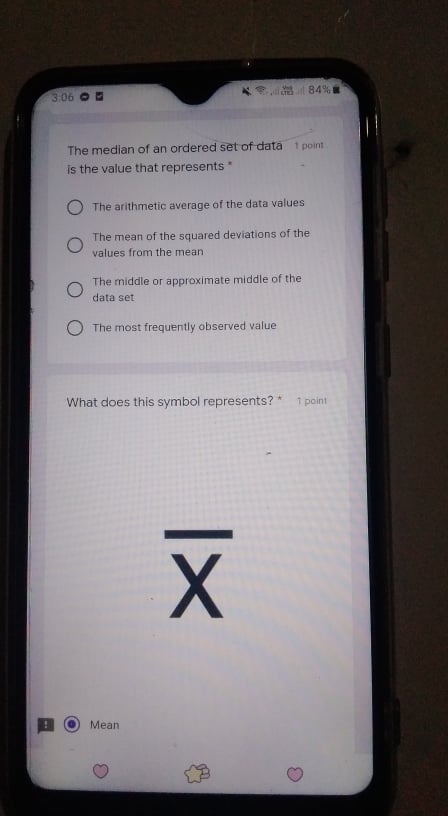
3.06 7 84% The mode score on the math 152 test 1 point of UPang students was 94! Which of these interpretations must be correct? * O 99 was the highest score on the test. No student scored below a 50 O A score of 91 was slightly below average. O More students received a 94 than any other score In University of Pangasina, GPA's are 1 point normally distributed with a mean of 2.9 and standard deviation of 0.6. What percentage of freshmen students at the College level have a GPA between 2.3 and 3.5?* 1009% 76.24% O 683% O 99.7% 84% 95% O306 0 3 * 7 6 84%% If the Pearson correlation co-efficient 1 paint R is equal to 1 then * O There is a perfect positive relationship between the two variables O There Is a positive relationship between the two variables O There is no relationship between the two variables O There is a negative relationship between the two variables If the variance of a data set is 228.77, 1 point what is the standard deviation? * * O 7.380 O 14.255 O 15.125 O 50 50 O 5.500 O 48.650 While computing the arithmetic mean I mad B3:07 0 * 3 6 84% docs.google.com O 5.500 O 48.650 While computing the arithmetic mean 1 point of a frequency distribution, the each value of a class is considered equal to: upper limit O lower class boundary O lower limit O Class interval O upper class boundary class mark The table shows the distribution of 1 point sizes of uniforms in UPANG. Calculate the standard deviation of the distribution of data. "3:05 0 * Balland 84% PART I. MULTIPLE CHOICE Find the Value of mean for the below 1 palfil data. * Class interval FREQUENCY 1-10 11-20 21-30 7 31-40 16 41-50 51-60 O 33.5 O 33 O 32 O 34 O 32.5 What is the the total area under the 1 point standard normal distribution curve?* 100 0.5 O3:06 0 5 The median of an ordered set of data 1 point is the value that represents " O The arithmetic average of the data values O The mean of the squared deviations of the values from the mean C The middle or approximate middle of the data set The most frequently observed value What does this symbol represents? * 1 point XI Mean O O
Step by Step Solution
There are 3 Steps involved in it
Step: 1
Get Instant Access to Expert-Tailored Solutions
See step-by-step solutions with expert insights and AI powered tools for academic success
Step: 2
Step: 3
Ace Your Homework with AI
Get the answers you need in no time with our AI-driven, step-by-step assistance