Answered step by step
Verified Expert Solution
Question
1 Approved Answer
3.10 Using data from 2013 on 64 black females, the estimated log-linear regression between WAGE (earn- ings per hour, in S) and years of

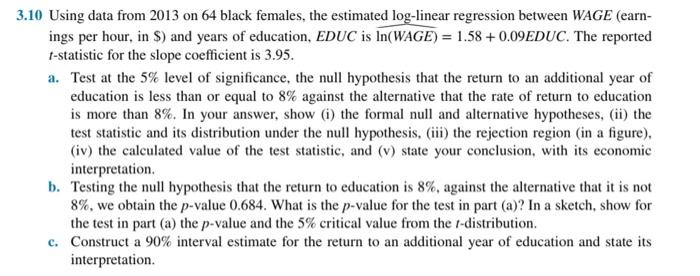
3.10 Using data from 2013 on 64 black females, the estimated log-linear regression between WAGE (earn- ings per hour, in S) and years of education, EDUC is In(WAGE) = 1.58 +0.09EDUC. The reported 1-statistic for the slope coefficient is 3.95. a. Test at the 5% level of significance, the null hypothesis that the return to an additional year of education is less than or equal to 8% against the alternative that the rate of return to education is more than 8%. In your answer, show (i) the formal null and alternative hypotheses, (ii) the test statistic and its distribution under the null hypothesis, (iii) the rejection region (in a figure), (iv) the calculated value of the test statistic, and (v) state your conclusion, with its economic interpretation. b. Testing the null hypothesis that the return to education is 8%, against the alternative that it is not 8%, we obtain the p-value 0.684. What is the p-value for the test in part (a)? In a sketch, show for the test in part (a) the p-value and the 5% critical value from the /-distribution. c. Construct a 90% interval estimate for the return to an additional year of education and state its interpretation.
Step by Step Solution
There are 3 Steps involved in it
Step: 1
Answer to 310 a Hypothesis Testing i Null and Alternative Hypotheses H0 1 008 The return to an addit...
Get Instant Access to Expert-Tailored Solutions
See step-by-step solutions with expert insights and AI powered tools for academic success
Step: 2

Step: 3

Ace Your Homework with AI
Get the answers you need in no time with our AI-driven, step-by-step assistance
Get Started


