

Question
3.1CREATE and INTERPRET a histogram using the variable GasMoney (Amount of money spent on gas every week) i have already done the excel just need
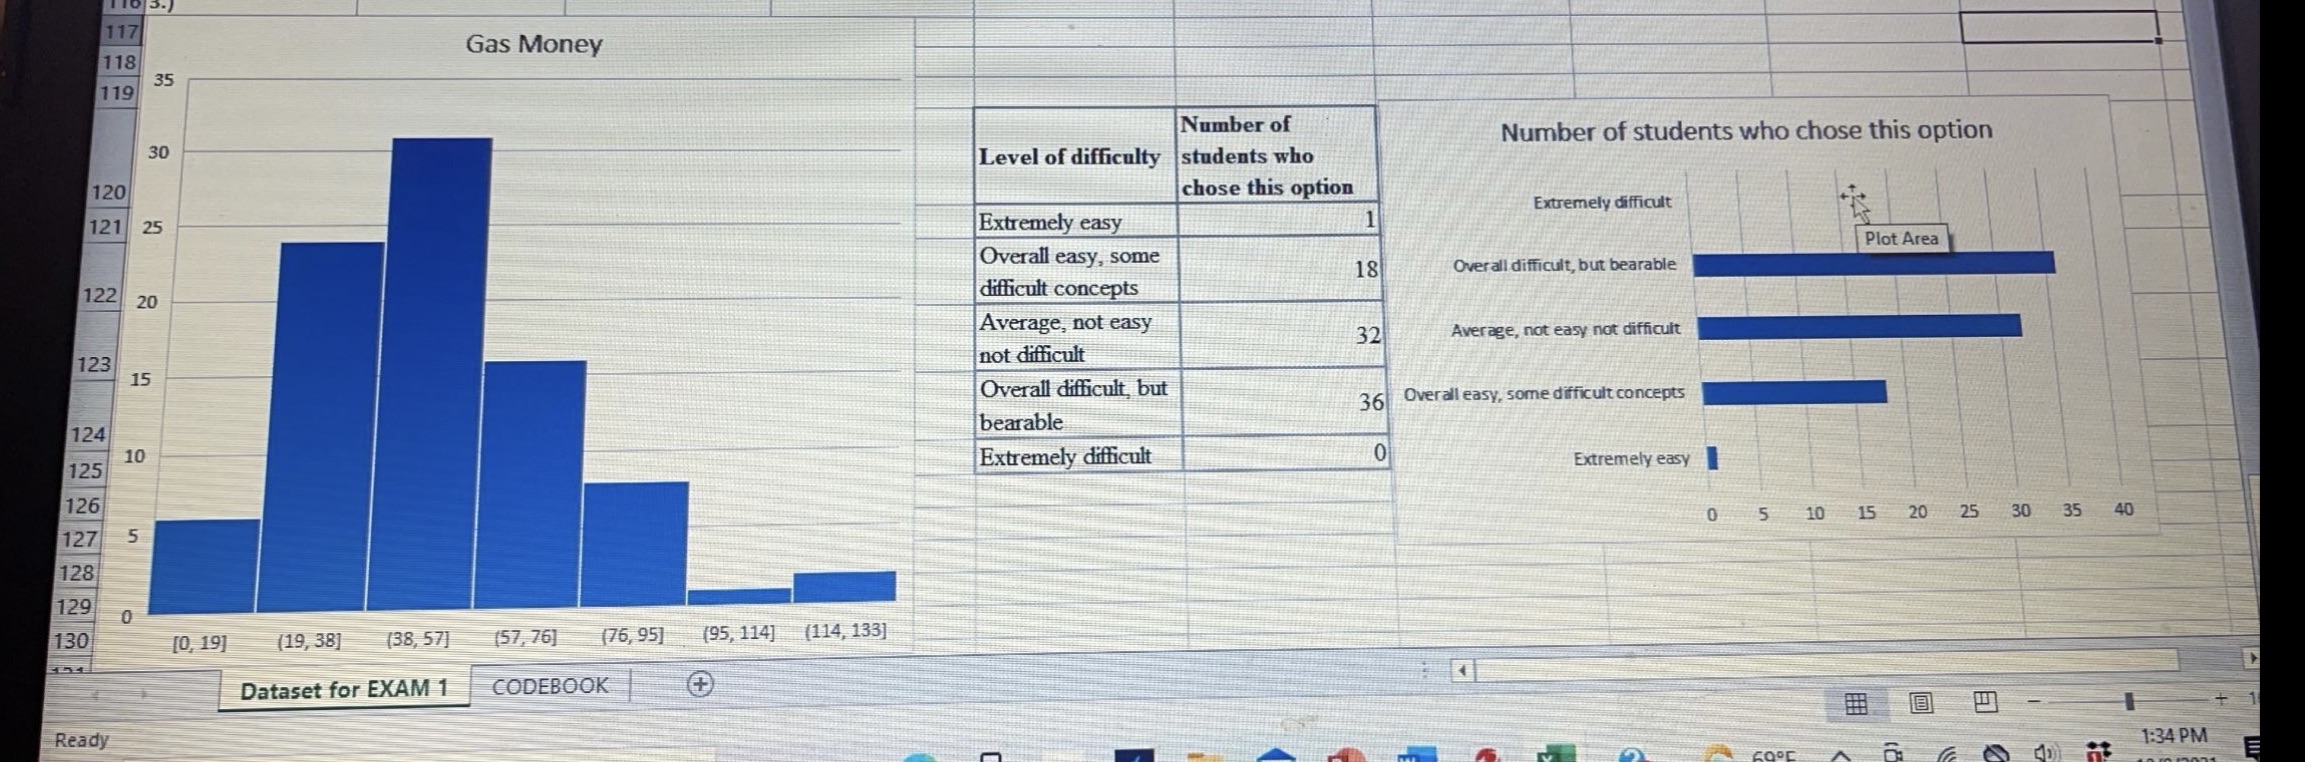
3.1CREATE and INTERPRET a histogram using the variable GasMoney (Amount of money spent on gas every week) i have already done the excel just need help with the math. 3.2. CREATE and INTERPRET the graph that best represents the vanableStatsDifficulty (On a scale of 1 to 5, how difficult do you find this stats class?).Values and frequencies are displayed below:
Step by Step Solution
There are 3 Steps involved in it
Step: 1

Get Instant Access to Expert-Tailored Solutions
See step-by-step solutions with expert insights and AI powered tools for academic success
Step: 2

Step: 3
Ace Your Homework with AI
Get the answers you need in no time with our AI-driven, step-by-step assistance
Get Started
Birds Higher Engineering Mathematics
Authors: John Bird
9th Edition
1000353036, 9781000353037